BioCentral IBBioCentral IB
IB BIOLOGY · THEME C · C1.3

Photosynthesis

A chloroplast catches sunlight and turns it into the sugar that will eventually fuel almost every other living thing on Earth — from an electron knocked loose by a single photon to a glucose molecule six carbon dioxide molecules in the making.
Guiding questions

How is energy from sunlight absorbed and used in photosynthesis?

How do abiotic factors interact with photosynthesis?

Part one

Photosynthesis as an energy transformation

C1.3.1 – C1.3.3
C1.3.1

Photosynthesis is an energy transformation

Photosynthesis transforms light energy into chemical energy, stored in the carbon compounds it produces — energy is converted from one form to another, never created from nothing.
  • Light energy absorbed by chlorophyll and accessory pigments becomes chemical potential energy, held in the carbon–carbon and carbon–hydrogen bonds of carbon compounds such as glucose.
  • Because photosynthesis is essentially the only large-scale entry point for chemical energy into food chains, this single transformation supplies most of the chemical energy needed for life processes throughout ecosystems.
Why it mattersRespiration later releases this same stored chemical energy — photosynthesis and respiration are the same energy transformation, running in opposite directions.
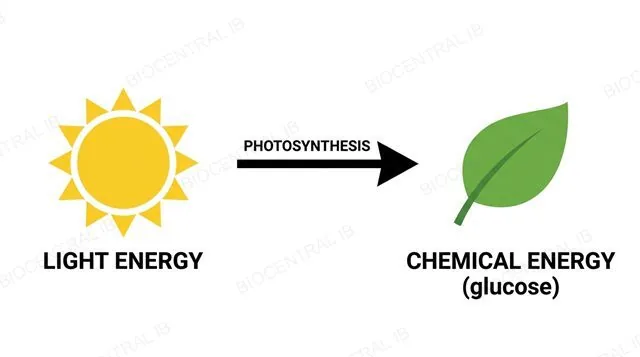
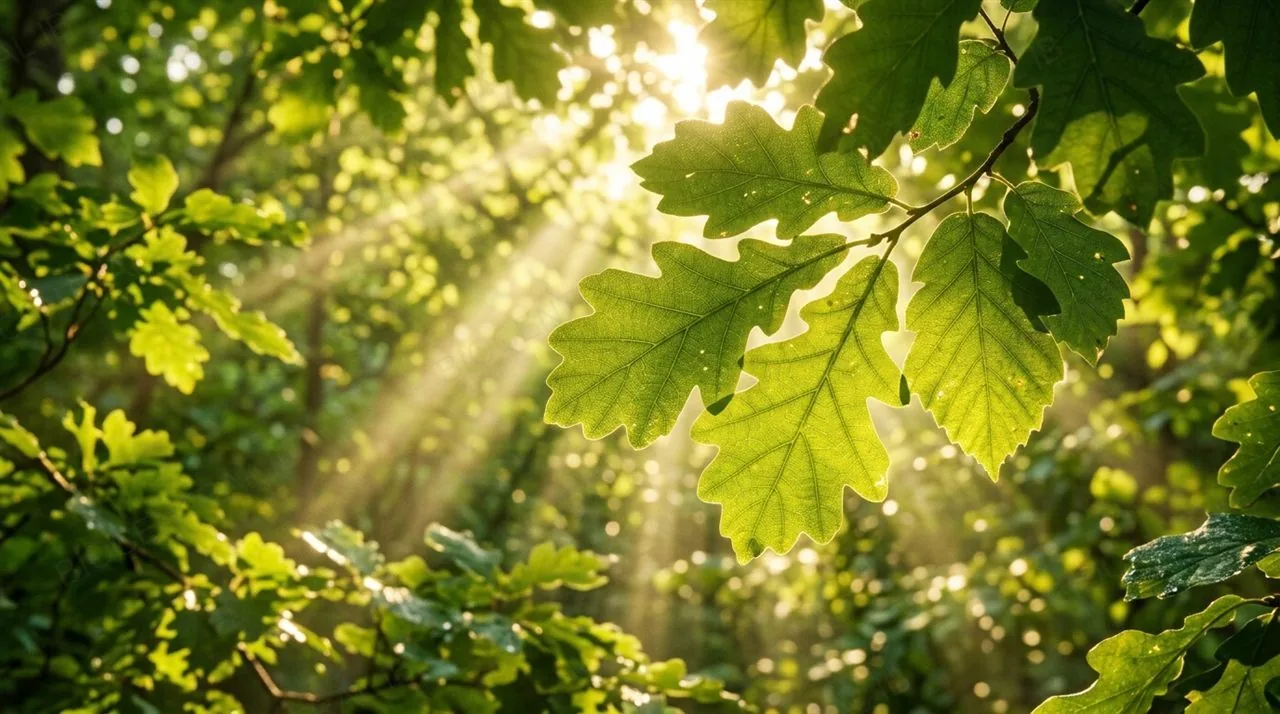
Diagram of light energy transforming into chemical energy stored in glucose during photosynthesis, labeled
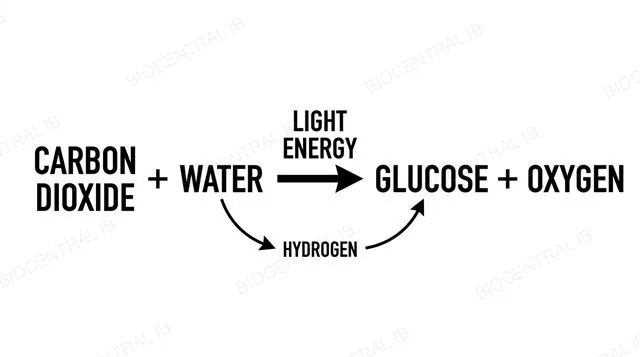
Word equation diagram for photosynthesis showing carbon dioxide plus water using light energy to form glucose plus oxygen, with hydrogen traced from water to glucose, labeled
C1.3.2

Carbon dioxide becomes glucose using hydrogen from water

The overall word equation for photosynthesis is: carbon dioxide + water → (light energy) → glucose + oxygen.
  • Converting carbon dioxide (CO₂) to glucose is a reduction — it requires an input of hydrogen, supplied as protons and electrons obtained from splitting water molecules, not from the carbon dioxide itself.
  • Reduced NADP (nicotinamide adenine dinucleotide phosphate, written NADPH) is the molecule that carries this hydrogen from where water is split to where carbon dioxide is reduced to carbohydrate.
Why it mattersA common exam slip is assuming the hydrogen in glucose comes from CO₂ — it comes entirely from water.
C1.3.3

Oxygen is a by-product, not the point

Plants, algae and cyanobacteria are described as oxygenic photosynthesisers: they release oxygen gas as a by-product of photosynthesis, and that oxygen comes entirely from the splitting of water.
  • The useful output of photosynthesis is the carbon compound produced, such as glucose — oxygen is simply released because splitting water is how the reaction obtains its hydrogen.
  • Ruben and Kamen (1941) confirmed this by feeding algae water labelled with the heavy oxygen isotope ¹⁸O: the oxygen gas released carried the ¹⁸O label, while the glucose produced did not.
Why it mattersEvery oxygen molecule released above a forest started out as part of a water molecule, not a carbon dioxide molecule.
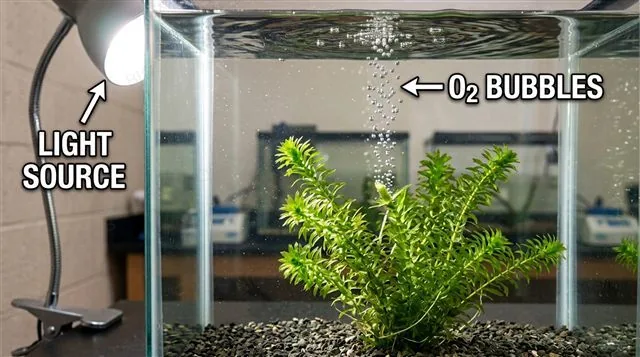
Aquatic pondweed underwater releasing a stream of oxygen bubbles from a cut stem under lamp light, labeled
Part two

Pigments, absorption and action spectra

C1.3.4 – C1.3.6
C1.3.4 · Application of skills

Chromatography separates the pigments a leaf contains

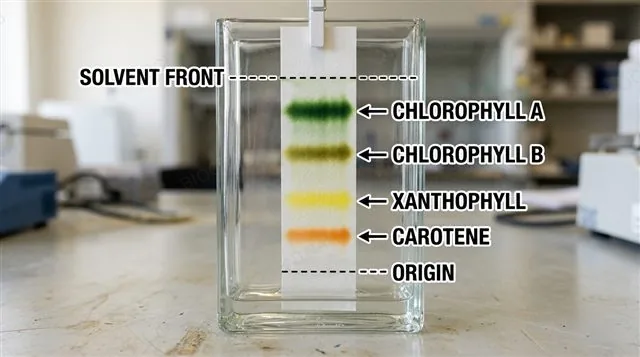
Paper or thin-layer chromatography separates a mixture of photosynthetic pigments extracted from a leaf into distinct bands, one per pigment, based on how far each travels up the paper.
  • A pigment sample is applied as a spot above the solvent line — never submerged in it — so the rising solvent front carries each dissolved pigment up the paper at its own rate.
  • Each pigment's retention factor, or Rf value (distance travelled by the pigment ÷ distance travelled by the solvent front), is calculated and compared with known reference values to identify it by colour and by value.
Why it mattersRf value identifies a pigment; it doesn't reveal its concentration or absorption spectrum.
Chromatography paper strip showing separated chlorophyll a, chlorophyll b, xanthophyll and carotene pigment bands with origin and solvent front lines labeled
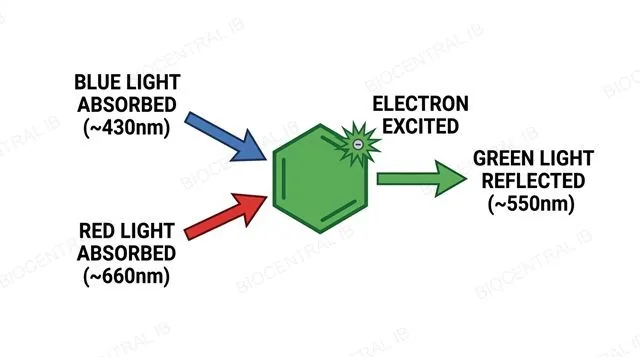
Diagram of a chlorophyll molecule absorbing blue and red light causing electron excitation while reflecting green light, labeled with wavelengths
C1.3.5

Chlorophyll absorbs blue and red, and reflects green

Photosynthetic pigments each absorb only specific wavelengths of light — the absorbed energy excites electrons within the pigment molecule to a higher energy level, beginning the transformation of light energy into chemical energy.
  • Chlorophyll absorbs strongly in the blue (around 430 nm) and red (around 660 nm) regions of the visible spectrum, but absorbs green light (around 550 nm) only weakly.
  • Unabsorbed green light is reflected or transmitted rather than used — which is the reason a healthy leaf appears green to the human eye, not because green light is somehow useless to the plant.
Why it mattersOnly the wavelengths a pigment actually absorbs can excite its electrons — reflected wavelengths contribute nothing to the light-dependent reactions.
C1.3.5

An absorption spectrum graphs what a pigment absorbs

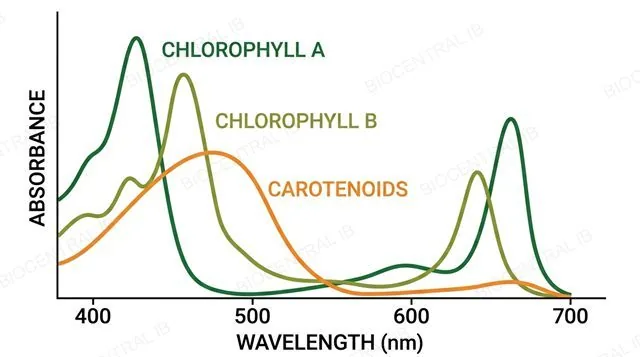
An absorption spectrum is a graph, plotted from spectrophotometer readings of an extracted pigment, showing how strongly that pigment absorbs light across the wavelengths (and corresponding colours) of the visible spectrum.
  • Chlorophyll a and chlorophyll b each produce a curve with two absorption peaks — one in the blue-violet region, one in the red — and a shared dip in the green.
  • Accessory pigments such as carotenoids absorb more strongly in the blue-green region than chlorophyll does, filling in part of the gap that chlorophyll a and b leave in the middle of the visible spectrum.
Why it mattersThe data booklet gives the wavelengths and colours of the visible spectrum needed to read an absorption spectrum's horizontal axis correctly.
Absorption spectrum graph showing wavelength against absorbance for chlorophyll a, chlorophyll b and carotenoids with two peaks each and a shared dip in green, labeled
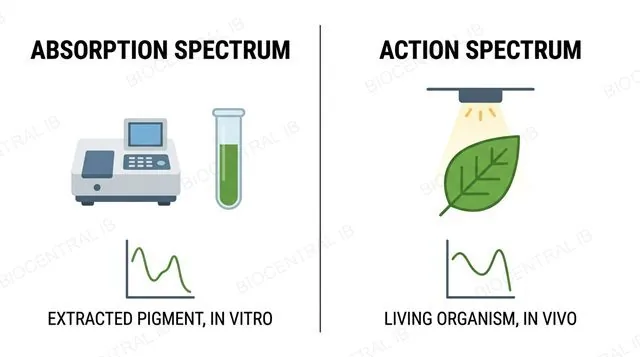
Side by side diagram comparing an absorption spectrum obtained from an extracted pigment in vitro against an action spectrum obtained from a living leaf in vivo, labeled
C1.3.6 · Application of skills

Absorption and action spectra measure different things

An absorption spectrum measures how much light an extracted pigment absorbs at each wavelength, using a spectrophotometer; an action spectrum measures a living organism's actual rate of photosynthesis at each wavelength.
  • An action spectrum is built from real oxygen-production or carbon-dioxide-consumption data recorded at a series of wavelengths on a living plant, then plotted as rate of photosynthesis against wavelength.
  • The two spectra share a broadly similar overall shape, because photosynthetic rate depends on how much light the plant's pigments absorb — but an action spectrum reflects every pigment acting together in a whole leaf, not one pigment in isolation.
Why it mattersAbsorption = an extracted pigment in a spectrophotometer; action = a living organism's real photosynthetic rate — a frequently tested distinction.
Part three

Limiting factors and investigating photosynthesis

C1.3.7 – C1.3.8
C1.3.7 · NOS

Good experimental design changes one factor at a time

Carbon dioxide concentration, light intensity and temperature can each limit the rate of photosynthesis, and each can be varied experimentally to test its individual effect.
  • To test one factor's effect, that factor is deliberately varied (the independent variable) while the others are held constant and kept in excess, so they cannot also become limiting during the investigation.
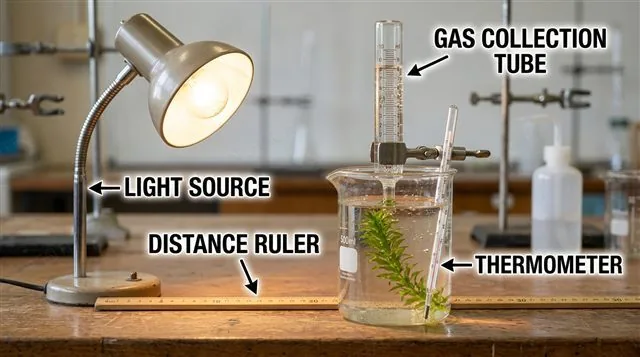
  • The rate of photosynthesis, the dependent variable, is then measured — often as the volume of oxygen gas produced per minute by an aquatic plant such as Elodea.
Why it mattersVarying more than one factor at once makes it impossible to attribute any change in rate to a single cause.
Elodea pondweed photosynthesis experiment apparatus with a lamp at a measured distance, a graduated gas collection tube and a thermometer, labeled
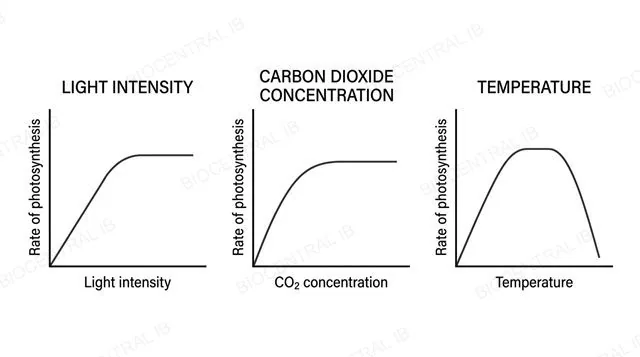
Three graphs showing rate of photosynthesis rising then plateauing against light intensity, carbon dioxide concentration and temperature, labeled
C1.3.7

Each limiting factor produces the same shape of curve

Plotting rate of photosynthesis against light intensity, carbon dioxide concentration or temperature each produces a curve that rises, then plateaus once a different factor takes over as the limit.
  • At low light intensity, low CO₂, or low temperature, that factor limits the rate directly; increasing it increases the rate until some other factor becomes limiting instead and the curve flattens.
  • Because light intensity follows an inverse square relationship with distance from a lamp, distance itself must first be converted into light intensity values before the data is plotted — plotting raw distance would distort the curve's true shape.
Why it mattersA plateau never means a factor has stopped mattering — it means a different factor has taken over as the actual limit.
C1.3.8

Carbon dioxide enrichment experiments predict tomorrow's plants

Carbon dioxide enrichment experiments raise the CO₂ concentration around growing plants to help predict how rising atmospheric CO₂ will affect future rates of photosynthesis and plant growth.
  • Enclosed greenhouse or chamber experiments raise CO₂ in a sealed, precisely controlled environment, which allows tight control but does not reproduce a real field's natural variability.
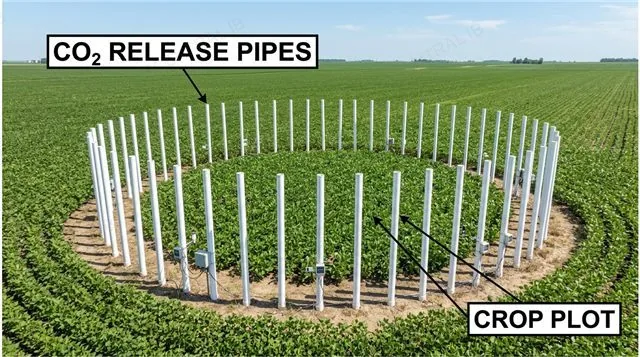
  • Free-air carbon dioxide enrichment (FACE) experiments instead pipe CO₂ into open-air field plots, exposing plants to realistic wind, pests, soil and weather alongside elevated CO₂ — trading some precise control for ecological realism.
Why it mattersGrowth from CO₂ enrichment typically plateaus once CO₂ stops being the limiting factor and something else, such as water or mineral nutrients, takes over.
Free-air carbon dioxide enrichment field experiment showing a ring of CO2 release pipes around an open-air crop plot, labeled
Quick check

An Elodea experiment shows the rate of O₂ production increasing as light intensity rises, then flattening out even though light keeps increasing. What is the best explanation?

Light is no longer the limiting factor — another factor, such as CO₂ concentration or temperature, is now limiting the rate instead
The plant has stopped photosynthesising entirely
Light intensity and rate of photosynthesis are never related once the plant is healthy
The plant has run out of chlorophyll
Correct answer: another factor has become limiting. A plateau means light is no longer what's holding the rate back — CO₂ concentration or temperature has taken over as the limiting factor, exactly as in the limiting-factor experiments and FACE studies in this section.
Part four · Additional higher level

Light-dependent reactions: photosystems, photolysis and chemiosmosis

C1.3.9 – C1.3.14 · HL
C1.3.9–10 · HL

A photosystem is an array, not a single molecule

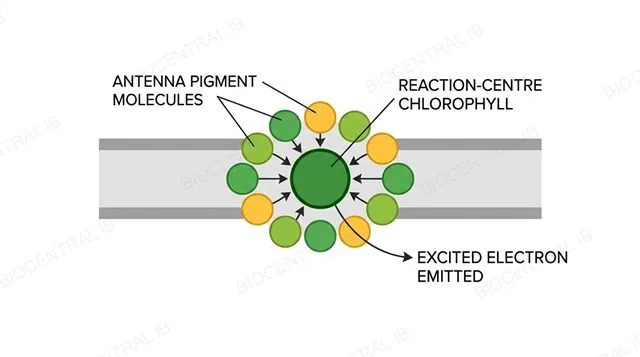
A photosystem is a molecular array of many chlorophyll and accessory pigment molecules, embedded in a membrane, with one special reaction-centre chlorophyll from which an excited electron is ultimately emitted.
  • Photosystems are always located in a membrane — the thylakoid membrane of a photosynthetic eukaryote's chloroplast, or the membrane of a cyanobacterium — never floating free in solution.
  • Light energy absorbed anywhere in the antenna array passes pigment to pigment until it reaches the reaction-centre chlorophyll, which becomes excited enough to emit an electron — a single isolated pigment could not do this alone.
  • This array of many pigment molecules increases the area over which photons can be intercepted, raising the rate energy reaches the reaction centre compared with one pigment working alone.
Why it matters"Many pigments funnelling to one reaction centre" is what lets a photosystem convert light into a fast, reliable electron supply.
Diagram of a photosystem showing antenna pigment molecules funnelling light energy inward to a reaction-centre chlorophyll that emits an excited electron, labeled
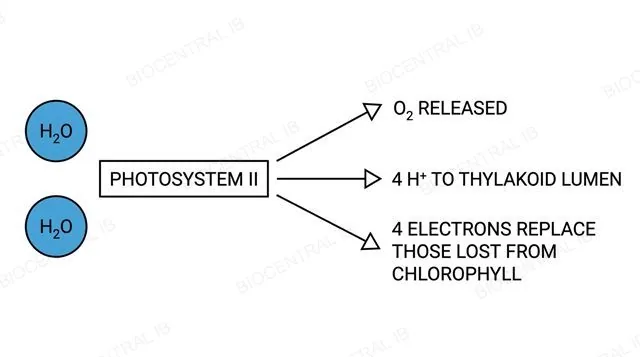
Diagram of photolysis at photosystem II showing two water molecules splitting into oxygen, four hydrogen ions and four electrons, labeled with arrows
C1.3.11 · HL

Splitting water at photosystem II makes oxygen a waste product

Photolysis is the light-driven splitting of water at photosystem II, and it is the source of the electrons that replace those emitted from the reaction-centre chlorophyll.
  • Photolysis splits two water molecules into oxygen gas, four hydrogen ions (H⁺) and four electrons: 2H₂O → O₂ + 4H⁺ + 4e⁻.
  • The electrons replace those photosystem II has just emitted; the H⁺ ions accumulate in the thylakoid lumen and contribute directly to the proton gradient used for ATP production; oxygen itself is released purely as a waste product.
Why it mattersThe advent of oxygen generation by photolysis, billions of years ago, permanently changed both the atmosphere and the course of evolution on Earth.
C1.3.12 · HL

A proton gradient across the thylakoid membrane makes ATP

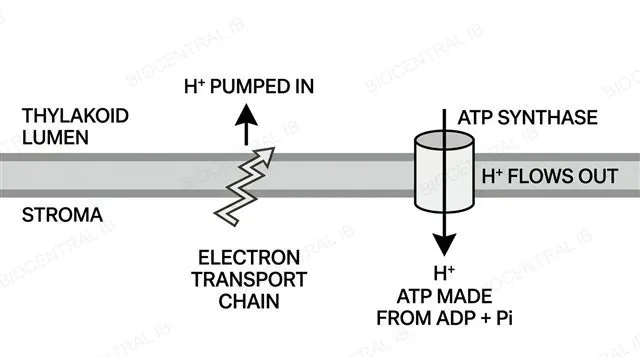
ATP (adenosine triphosphate) is produced in the light-dependent reactions by chemiosmosis: an electron transport chain uses the energy of excited electrons to pump hydrogen ions (H⁺, protons) from the stroma into the thylakoid lumen.
  • This pumping builds up a steep proton gradient across the thylakoid membrane — a high H⁺ concentration inside the lumen, a low one in the stroma.
  • Protons flow back down this gradient through ATP synthase, an enzyme embedded in the membrane, and the energy of that flow drives the synthesis of ATP from ADP and inorganic phosphate.
Why it mattersThis is the same chemiosmotic mechanism cells use in oxidative phosphorylation during respiration — only the membrane and the ultimate energy source (light, not glucose) differ.
Diagram of chemiosmosis across the thylakoid membrane showing the electron transport chain pumping H+ into the lumen and ATP synthase using the H+ gradient to make ATP, labeled
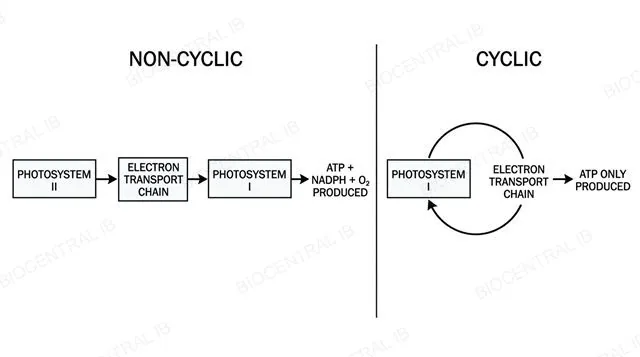
Side by side diagram comparing non-cyclic photophosphorylation through photosystem II and photosystem I against cyclic photophosphorylation looping through photosystem I alone, labeled
C1.3.12 · HL

Electrons can take a cyclic or non-cyclic route

Electrons used in ATP production are sourced either from photosystem I, in cyclic photophosphorylation, or from photosystem II, in non-cyclic photophosphorylation.
  • Non-cyclic photophosphorylation sources electrons from photosystem II — replaced by photolysis — and produces ATP, reduced NADP and oxygen as the electrons pass on to photosystem I and then to NADP⁺.
  • Cyclic photophosphorylation sources electrons only from photosystem I; instead of reducing NADP⁺, they cycle back through the electron transport chain to photosystem I, generating extra ATP without producing reduced NADP or oxygen.
Why it mattersCyclic photophosphorylation lets a chloroplast top up its ATP supply whenever the Calvin cycle needs relatively more ATP than reduced NADP.
C1.3.13 · HL

Photosystem I reduces NADP to NADPH

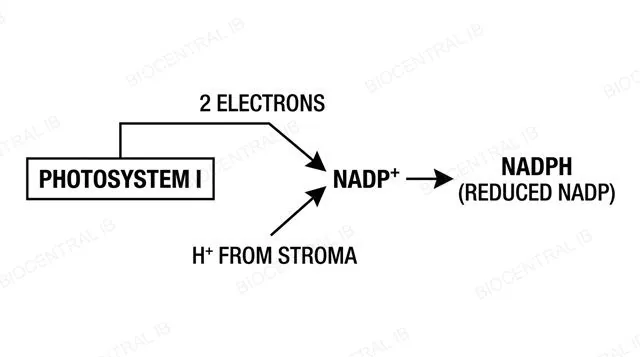
NADP (nicotinamide adenine dinucleotide phosphate) is reduced by accepting two electrons from photosystem I and a hydrogen ion from the stroma, becoming reduced NADP, or NADPH.
  • The paired terms NADP and reduced NADP — equivalently written NADP⁺ and NADPH — should always be used consistently, the same way ADP and ATP are paired.
  • Reduced NADP carries this captured reducing power out of the thylakoid membrane and into the stroma, where it will be used to reduce carbon dioxide in the Calvin cycle.
Why it mattersNADPH is the photosynthetic equivalent of NADH in respiration — but the two carry reducing power in opposite directions, one to build carbon compounds, one released from breaking them down.
Diagram of photosystem I emitting two electrons that combine with a hydrogen ion from the stroma to reduce NADP+ to NADPH, labeled
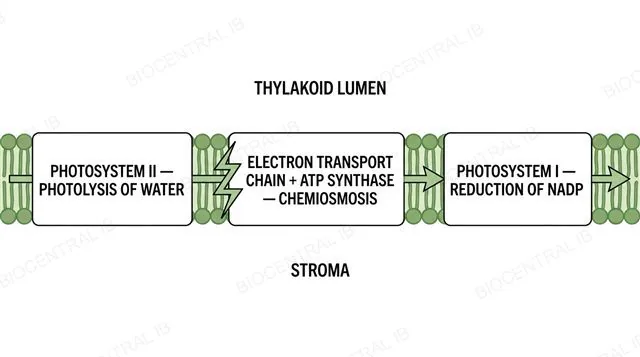
Diagram of the thylakoid membrane showing photosystem II photolysis, the electron transport chain and ATP synthase chemiosmosis, and photosystem I NADP reduction in sequence, labeled
C1.3.14 · HL

One membrane runs the whole light-dependent system

The thylakoid membrane is where the entire light-dependent system operates: photolysis at photosystem II, chemiosmotic ATP production across the membrane, and reduction of NADP at photosystem I all happen there, in that physical order.
  • Photosystem II splits water, replacing its own emitted electrons and releasing O₂ and H⁺ into the thylakoid lumen; those electrons then pass along an electron transport chain that pumps still more H⁺ into the lumen.
  • ATP synthase uses the resulting proton gradient to make ATP as H⁺ flows back into the stroma; the same electrons, now at photosystem I, go on to reduce NADP⁺ to NADPH using a further H⁺ from the stroma.
Why it mattersEvery component of the light-dependent reactions has a fixed, known physical address on this one membrane — nothing here happens in the stroma.
Quick check · HL

In non-cyclic photophosphorylation, which correctly traces where the electrons that end up reducing NADP⁺ originally came from?

Water, split at photosystem II by photolysis
ATP hydrolysis in the stroma
Carbon dioxide fixed by Rubisco
Glucose broken down in the mitochondria
Correct answer: water, via photolysis at photosystem II. Photolysis splits water into O₂, H⁺ and electrons; those electrons replace the ones photosystem II emitted, travel through the electron transport chain to photosystem I, and are re-excited there before reducing NADP⁺ to NADPH.
Part five · Additional higher level

The Calvin cycle and interdependence

C1.3.15 – C1.3.19 · HL
C1.3.15 · HL

Rubisco fixes carbon dioxide onto a five-carbon sugar

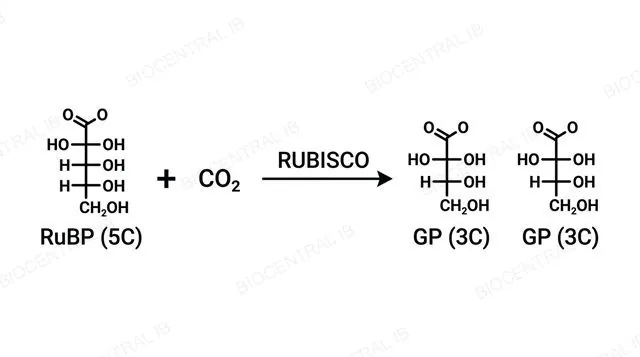
Carbon fixation is catalysed by Rubisco (ribulose bisphosphate carboxylase/oxygenase), which adds carbon dioxide to RuBP (ribulose bisphosphate, a five-carbon sugar) to produce two molecules of glycerate 3-phosphate (GP), each three carbons long.
  • Rubisco is the most abundant enzyme on Earth, and high concentrations of it are needed in the stroma because it works relatively slowly and is not effective at low carbon dioxide concentrations.
  • Rubisco is also an oxygenase: when it fixes O₂ instead of CO₂, the resulting photorespiration wastes ATP and reduces the overall efficiency of photosynthesis.
Why it mattersAn enzyme this abundant and this slow is exactly the kind of trade-off carbon fixation has been stuck with since it evolved.
Diagram of Rubisco catalysing RuBP plus carbon dioxide to form two molecules of glycerate 3-phosphate, labeled with carbon counts
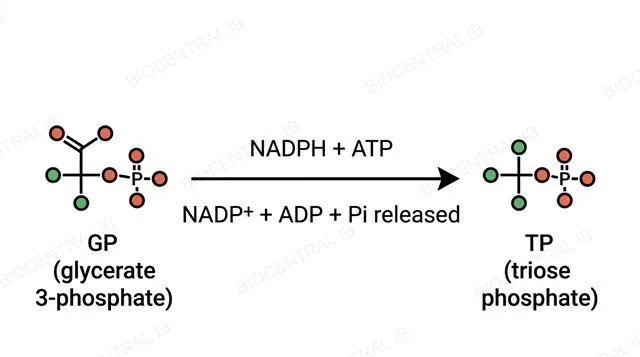
Diagram of glycerate 3-phosphate being converted into triose phosphate using NADPH and ATP from the light-dependent reactions, labeled
C1.3.16 · HL

Reduction converts GP into triose phosphate

Glycerate 3-phosphate (GP), the product of carbon fixation, is converted into triose phosphate (TP) using the ATP and reduced NADP (NADPH) supplied by the light-dependent reactions.
  • This reduction step is where the chemical energy and reducing power captured in the light-dependent reactions are actually spent to build a genuine carbon-based sugar.
  • ADP and NADP⁺ are released back from this step and returned to the light-dependent reactions, where they will be recharged into ATP and NADPH again.
Why it mattersTriose phosphate, not glucose, is the direct product of the Calvin cycle — two triose phosphate molecules must combine to form one glucose.
C1.3.17 · HL

Most of the triose phosphate goes back to regenerating RuBP

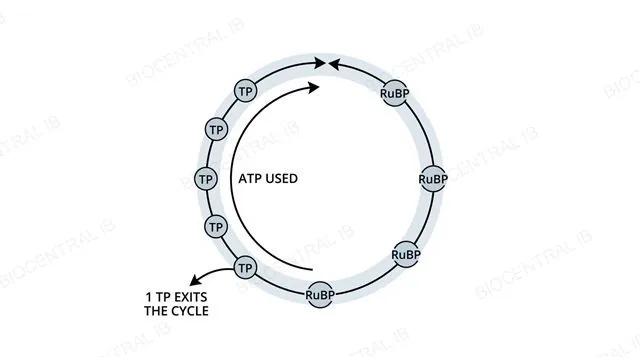
For the Calvin cycle to keep running, most of the triose phosphate (TP) it produces must be converted back into RuBP (ribulose bisphosphate), using more ATP from the light-dependent reactions.
  • Five molecules of triose phosphate are converted into three molecules of RuBP in this regeneration step, allowing carbon fixation to continue on the next turn of the cycle.
  • If glucose is the eventual product, five-sixths of all the triose phosphate the cycle makes must be recycled into RuBP this way — only one-sixth is actually available to leave the cycle.
Why it mattersThe Calvin cycle spends most of its own output just keeping itself supplied with RuBP — very little escapes to build anything else.
Cycle diagram showing five triose phosphate molecules using ATP to regenerate three RuBP molecules, with one triose phosphate exiting the cycle, labeled
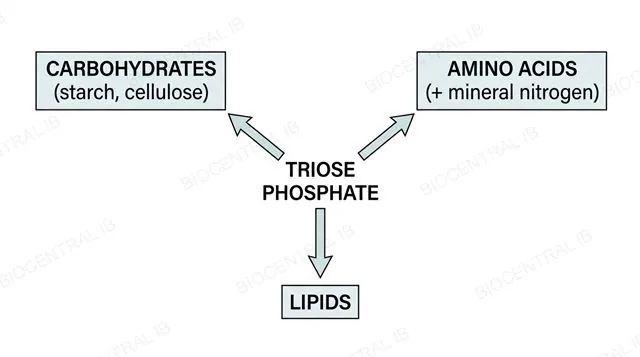
Diagram showing triose phosphate branching into carbohydrates, amino acids using mineral nitrogen, and lipids, labeled
C1.3.18 · HL

Triose phosphate builds more than just glucose

All of the carbon in the compounds of a photosynthesising organism is fixed in the Calvin cycle, and carbon compounds other than glucose are built from Calvin cycle intermediates by further metabolic pathways.
  • Carbohydrates such as starch and cellulose can be traced back to a triose phosphate intermediate without needing anything beyond what the Calvin cycle itself supplies.
  • Amino acids additionally require a mineral nutrient supplying nitrogen — such as nitrate ions absorbed from the soil — combined with a carbon skeleton the Calvin cycle has already provided.
Why it mattersNot every carbon compound in a plant is glucose or made purely from CO₂ and water — some also need mineral nutrients from outside the cycle entirely.
C1.3.19 · HL

Light-independent doesn't mean independent of light

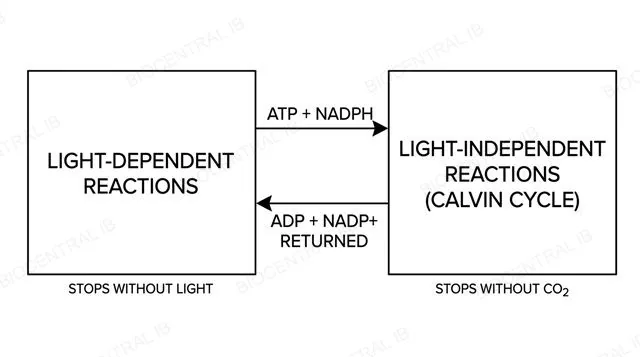
The Calvin cycle's own enzymes don't require light directly — but the cycle still depends entirely on the ATP and reduced NADP that only the light-dependent reactions can supply.
  • A lack of light stops the light-dependent reactions, which stops ATP and NADPH production, which then stops the Calvin cycle as soon as existing supplies run out — even though the Calvin cycle's own chemistry needs no light.
  • In the other direction, a lack of carbon dioxide prevents photosystem II from functioning normally, because the Calvin cycle can no longer use up the ATP and NADPH being produced, and the whole system backs up.
Why it matters"Light-independent" is a name for where light acts directly, not a claim that the Calvin cycle can run indefinitely once the lights go out.
Diagram showing the light-dependent reactions supplying ATP and NADPH to the light-independent reactions and receiving ADP and NADP+ back, each side labeled with what stops it, labeled

Key vocabulary — SL & HL

Worth being able to define each in a single sentence

Pigment
A coloured molecule, such as chlorophyll or a carotenoid, that absorbs specific wavelengths of light.
Rf value
Distance travelled by a pigment ÷ distance travelled by the solvent front in chromatography.
Absorption spectrum
A graph of how strongly an extracted pigment absorbs light across the visible spectrum.
Action spectrum
A graph of a living organism's rate of photosynthesis at each wavelength of light.
Limiting factor
Whichever variable — light, CO₂ or temperature — is currently holding back the rate of photosynthesis.
FACE
Free-air carbon dioxide enrichment: raising CO₂ around crops in open, unenclosed field plots.

Key vocabulary — HL HL

Additional higher level terms, worth being able to define each in a single sentence

Photolysis
The light-driven splitting of water at photosystem II into oxygen, H⁺ and electrons.
Chemiosmosis
ATP production driven by H⁺ flowing down its concentration gradient through ATP synthase.
Photophosphorylation
ATP synthesis driven by light — cyclic (photosystem I only) or non-cyclic (both photosystems).
Rubisco
The carboxylase/oxygenase enzyme that fixes CO₂ onto RuBP to start the Calvin cycle.
RuBP
Ribulose bisphosphate: the five-carbon sugar CO₂ is added onto during carbon fixation.
Triose phosphate (TP)
The three-carbon sugar that is the Calvin cycle's actual direct product, not glucose.

Where this shows up again

C1.2
Photosynthesis produces glucose, which is used in cell respiration (C1.2). Compare the ATP yield from the complete oxidation of one glucose molecule with the ATP cost of synthesising one glucose molecule via photosynthesis.
B2.1
The thylakoid membrane contains phospholipids and embedded proteins similar to the cell membrane (B2.1). Explain why the thylakoid membrane must be impermeable to H⁺, and how this relates to chemiosmosis.
B3.1
Stomata (B3.1) allow CO₂ entry for photosynthesis but also allow water loss by transpiration. Discuss this trade-off and how C₄ and CAM plants resolve it differently.
C4.2
Photosynthesis removes CO₂ from the atmosphere while respiration (C4.2) returns it. Explain how these two processes interact in the global carbon cycle and how human activities have altered this balance.

C1.3 Photosynthesis — one-page recap

Screenshot this slide to revise from

The equation & energy transformation
  • CO₂ + H₂O + light → glucose + O₂; H comes from water, O₂ is a by-product.
  • Photosynthesis is an energy transformation: light energy → chemical energy in carbon compounds.
Pigments & spectra
  • Chromatography: Rf = pigment distance ÷ solvent distance.
  • Absorption spectrum (extracted pigment) vs action spectrum (living rate) — similar shape, different method.
Limiting factors
  • Light, CO₂ and temperature each limit the rate until another factor takes over (plateau).
  • FACE experiments test CO₂ enrichment under real field conditions.
HL · Light-dependent reactions
  • Photosystem II: photolysis of water → O₂, H⁺, e⁻ (replace lost electrons).
  • Chemiosmosis: H⁺ gradient drives ATP synthase; photosystem I reduces NADP⁺ to NADPH.
HL · Calvin cycle
  • Rubisco fixes CO₂ onto RuBP → GP → triose phosphate (TP), using ATP + NADPH.
  • 5 TP → 3 RuBP regenerates the cycle; TP also builds amino acids (+ mineral N), lipids.
HL · Interdependence
  • No light → no ATP/NADPH → Calvin cycle stops.
  • No CO₂ → photosystem II backs up and stops functioning too.

Every glucose molecule is stored sunlight, six carbons at a time

From an excited electron in a thylakoid membrane to a triose phosphate leaving the Calvin cycle, photosynthesis is one continuous transformation — light in, chemical energy out.
C1.3 Photosynthesis · BioCentral IB
Use ↓ ↑ or click to navigate
01 / 35