BioCentral IBBioCentral IB
IB Biology · Theme C · C4.2

Transfers of energy and matter

Sunlight enters an ecosystem once and eventually leaves as heat forever, but carbon loops back around, again and again. This lesson follows both currencies — energy and matter — from the moment light strikes a leaf, through every trophic transfer, to the decomposers, sinks and sources that decide whether an ecosystem locks carbon away or lets it go.
Guiding questions

What is the reason matter can be recycled in ecosystems but energy cannot?

How is the energy that is lost by each group of organisms in an ecosystem replaced?

Part one

Ecosystems, energy flow and feeding relationships

C4.2.1 – C4.2.5
C4.2.1

An ecosystem lets everything cross its border

An ecosystem is an open system: both energy and matter can enter and exit across its boundary, unlike a closed system, where only energy passes in and out.
  • Energy typically enters as sunlight and leaves as heat, while matter — water, nutrients, migrating animals, wind-blown seeds — crosses the boundary in either direction.
  • A sealed, transparent terrarium is a genuine closed system: light and heat still cross its glass, but no water, gas or organism can enter or leave.
  • No real ecosystem is ever truly closed, let alone isolated — "open" is the default state of every ecosystem studied in this course.
Why it mattersConfusing "closed" with "isolated" is the most common error tested on this statement.
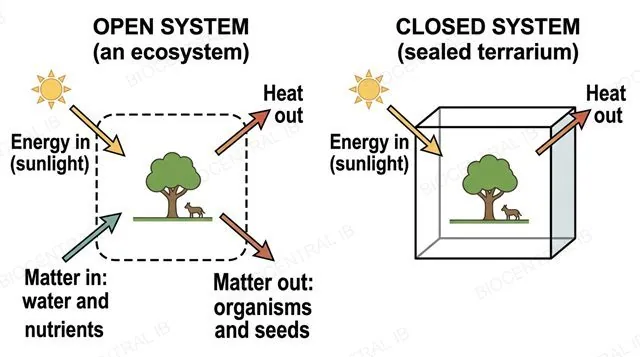
A flat two-panel diagram: left panel, an open system (an ecosystem) with a dashed boundary and four arrows crossing it for energy in, heat out, matter in and matter out; right panel, a closed system (a sealed terrarium) with a solid boundary and only two arrows, energy in and heat out, and no matter arrows
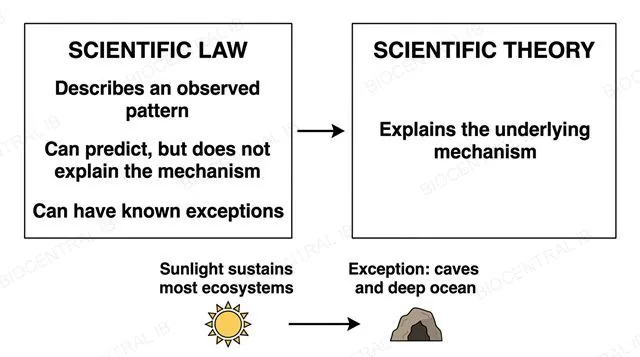
A flat diagram comparing a scientific law, which describes a pattern and predicts without explaining and can have exceptions, against a scientific theory, which explains the underlying mechanism, illustrated below by sunlight sustaining most ecosystems with an exception shown for caves and the deep ocean
C4.2.2 · NOS

Sunlight runs most ecosystems — but not all

Sunlight is the principal energy source sustaining most ecosystems: photoautotrophs capture it and convert it into the chemical energy that flows through almost every food chain.
  • Caves and ocean depths below light penetration are exceptions: chemoautotrophs there base the food web on chemical energy from oxidation reactions instead.
  • "Sunlight sustains most ecosystems" is a scientific law: a generalized rule describing an observed pattern that predicts, without explaining, the underlying mechanism.
  • Unlike a theory, a law can carry known exceptions and stay useful — the cave and deep-ocean cases bound the rule rather than invalidating it.
Why it mattersRecognizing this as a law, not a theory, is itself part of what this NOS point assesses.
C4.2.3

Energy moves one feeding step at a time

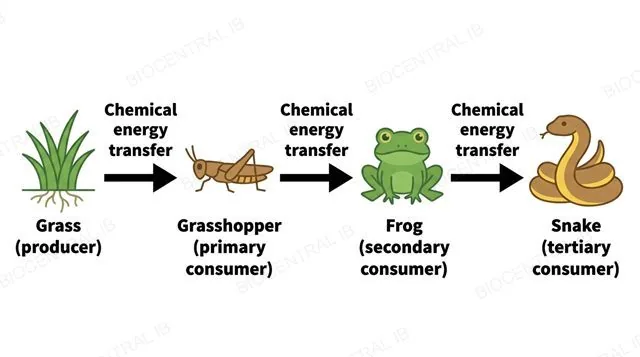
Chemical energy flows through a food chain as each organism feeds on the one before it, always moving in one direction.
  • In grass → grasshopper → frog → snake, the snake gets chemical energy the grass fixed, passed on stepwise — never captured from sunlight directly.
  • A consumer can only acquire energy still present in the biomass it eats and assimilates; energy the previous organism already used or released as heat is gone for good.
  • Energy therefore only ever flows one way along a chain, decreasing at each step, never returning back toward the producer.
Why it mattersName the real mechanism — feeding transfers only remaining, assimilated energy — rather than vaguely restating that energy simply "passes along."
A flat horizontal food chain diagram of four organism icons in order, grass producer, grasshopper primary consumer, frog secondary consumer, snake tertiary consumer, connected by three left-to-right arrows each labeled chemical energy transfer
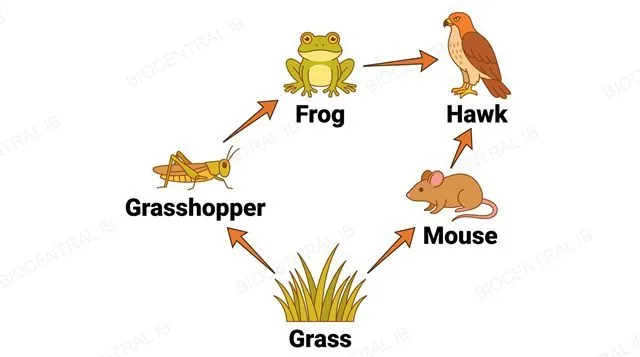
A flat food web diagram with five organism icons, grass, grasshopper, mouse, frog and hawk, with grass at the bottom and arrows pointing from each organism to whatever eats it, showing multiple overlapping feeding paths rather than one straight line
C4.2.4

Real communities are webs, not lines

A food web shows the overlapping feeding relationships within a real community, built from the species actually present and the observed direction of energy and biomass transfer between them.
  • Arrows point from the eaten organism toward its eater — the direction of energy and biomass transfer, not of attack.
  • Most organisms feed on, or are fed on by, more than one species, so a single food chain rarely captures a community's real feeding relationships alone.
  • Building a food web from field observations of a real, local community is the practical skill expected here, not an invented set of relationships.
Why it mattersA single food chain oversimplifies most real communities; a food web is closer to how energy actually moves.
C4.2.5

Death still has energy left in it

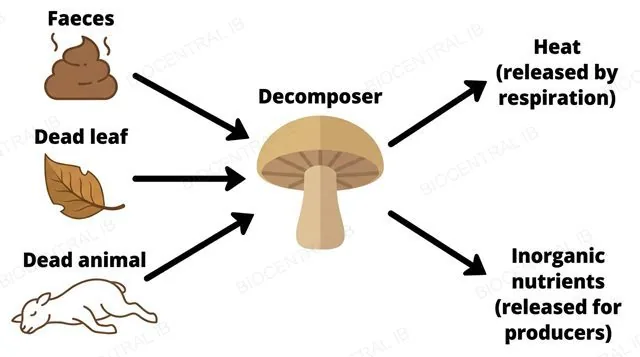
Decomposers obtain their energy from carbon compounds in dead organic matter — faeces, dead parts of organisms, and dead whole organisms.
  • Because decomposers act on dead matter from every trophic level at once, rather than one linear feeding sequence, they are usually left off a standard food chain diagram.
  • Decomposers still respire to release the remaining energy in dead matter, ultimately losing it as heat, exactly as any other heterotroph does.
  • Breaking down these compounds also releases the inorganic nutrients they contain, making them available again to producers — a separate but linked role.
Why it mattersLeaving decomposers off a diagram never means they're unimportant — their role in both energy transformation and nutrient recycling is examinable in its own right.
A flat diagram showing three sources, faeces, a dead leaf and a dead animal, each with an arrow into a central decomposer fungus icon, which has two outward arrows labeled heat released by respiration and inorganic nutrients released for producers
Quick check

A sealed, transparent laboratory terrarium allows sunlight to enter and heat to escape through its glass, but nothing else ever crosses its boundary once it is sealed. How should this terrarium be classified?

A closed system — energy (light in, heat out) crosses the boundary, but no matter does
An open system, because sunlight is entering it
An isolated system, because it is sealed
It cannot be classified, since ecosystems are always open
Correct answer: closed system. A closed system exchanges energy with its surroundings but not matter — exactly this terrarium. An isolated system would exchange neither; a real ecosystem, unlike this terrarium, is open and exchanges both.
Part two

Autotrophs, heterotrophs and releasing energy

C4.2.6 – C4.2.9
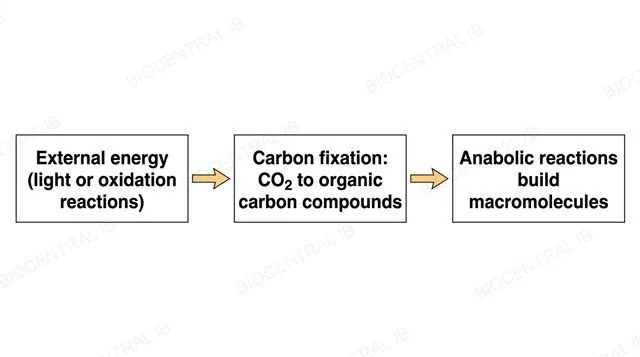
A flat left-to-right diagram of three boxes, external energy light or oxidation reactions, then carbon fixation converting CO2 to organic carbon compounds, then anabolic reactions building macromolecules, connected by two single arrows
C4.2.6

Building matter costs energy

Autotrophs are organisms that use an external energy source to synthesize the carbon compounds they need from simple inorganic substances, chiefly carbon dioxide.
  • Carbon fixation — converting inorganic CO2 into organic carbon compounds — is an energy-requiring process, which is exactly why autotrophs need an external energy source to drive it in the first place.
  • Once fixed, the resulting simple carbon compounds still must be built up further into macromolecules — carbohydrates, lipids, proteins — through anabolic reactions that also require an energy input.
  • Both steps together mean an autotroph's synthesis pathway is fundamentally energy-consuming from start to finish, never energy-releasing.
Why it mattersCarbon fixation is endergonic, not exergonic — a frequent point of confusion when comparing autotrophs to the energy-releasing reactions of respiration.
C4.2.7

Two very different power sources

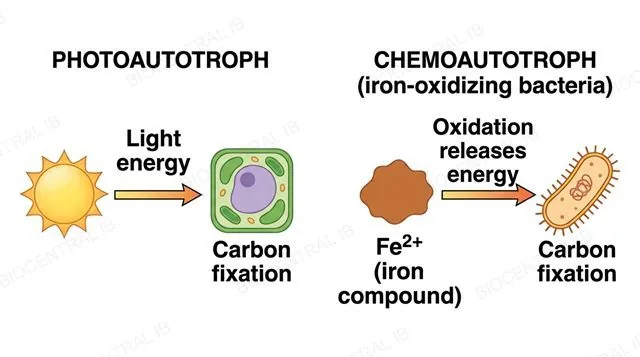
Photoautotrophs use light as their external energy source for carbon fixation, while chemoautotrophs use the energy released by oxidation reactions instead.
  • Iron-oxidizing bacteria illustrate chemoautotrophy: oxidising an inorganic iron compound releases energy, which the bacterium uses to fix carbon dioxide into organic compounds — no light required.
  • Oxidation reactions work as an energy source precisely because they release, rather than absorb, energy as they occur, which organisms can capture.
  • Only a basic grasp of iron-oxidizing bacteria as an example is expected — the detailed biochemical pathway is outside this course's scope.
Why it mattersPhotoautotrophs and chemoautotrophs both fix carbon the same way in the end — the entire difference lies in where the driving energy comes from.
A flat two-panel diagram, left panel photoautotroph with a sun and an arrow labeled light energy into a plant cell labeled carbon fixation, right panel chemoautotroph iron-oxidizing bacteria with an iron compound Fe2+ and an arrow labeled oxidation releases energy into a bacterium labeled carbon fixation
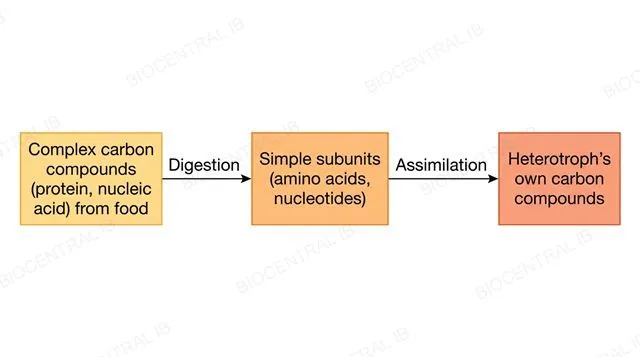
A flat left-to-right sequence of three boxes, complex carbon compounds protein and nucleic acid from food, then simple subunits amino acids and nucleotides after an arrow labeled digestion, then heterotroph's own carbon compounds after an arrow labeled assimilation
C4.2.8

Someone else's molecules, rebuilt

Heterotrophs obtain carbon compounds already made by other organisms and use them to synthesize the carbon compounds that they themselves require.
  • A protein or nucleic acid from food cannot be used unmodified — it is first digested, internally or externally, into simple subunits such as amino acids and nucleotides.
  • The heterotroph then assimilates these subunits, using them to construct its own required carbon compounds, which may be entirely different molecules from the ones originally eaten.
  • This definition covers decomposers as much as consumers: any organism obtaining carbon compounds from other organisms, by any feeding method, is a heterotroph.
Why it mattersEating a protein does not mean "gaining that protein" — digestion and reassembly into new molecules are the actual, examinable mechanism.
C4.2.9

Every living thing respires

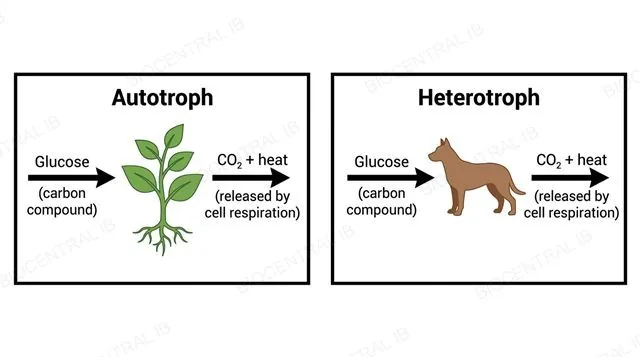
Both autotrophs and heterotrophs release energy from carbon compounds by the oxidation of those compounds during cell respiration.
  • Autotrophs capture external energy — light, or oxidation reactions — into carbon compounds through fixation, but they still need cell respiration, continuously, to release usable energy for their own life processes.
  • This means plants respire at all times, not only at night — photosynthesis is limited to daylight, but respiration is not.
  • Photoheterotrophs, organisms that use light for energy but still obtain carbon compounds from other organisms, are an unusual category this course does not require.
Why it matters"Only heterotrophs respire" is a genuine, commonly tested misconception — respiration is a universal energy-release process, not one restricted to animals.
A flat two-panel diagram, left panel a plant labeled autotroph, right panel an animal labeled heterotroph, each with one arrow labeled glucose carbon compound pointing in and one arrow labeled CO2 plus heat released by cell respiration pointing out
Part three

Trophic levels, energy pyramids and production

C4.2.10 – C4.2.16
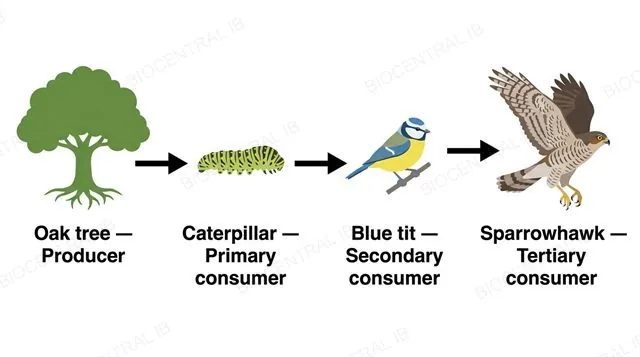
A flat horizontal food chain of four organism icons each with its trophic level printed below, oak tree producer, caterpillar primary consumer, blue tit secondary consumer, sparrowhawk tertiary consumer, connected by three left-to-right arrows
C4.2.10

The same species, different levels

Organisms are classified into trophic levels — producer, primary, secondary, tertiary consumer — by their position in a specific food chain.
  • In oak tree → caterpillar → blue tit → sparrowhawk, the caterpillar is the primary consumer, the blue tit secondary, the sparrowhawk tertiary — counted forward from the producer.
  • Many organisms have a varied diet and occupy different levels in different chains — a fox eating blackberries is a primary consumer, but eating a rabbit makes it secondary.
  • Trophic level describes feeding position within one chain at a time, never a fixed label attached permanently to a species.
Why it mattersTrophic level classification always counts forward from the producer — not backward from whichever predator happens to be the focus of the question.
C4.2.11 · Skills

Drawing energy to scale

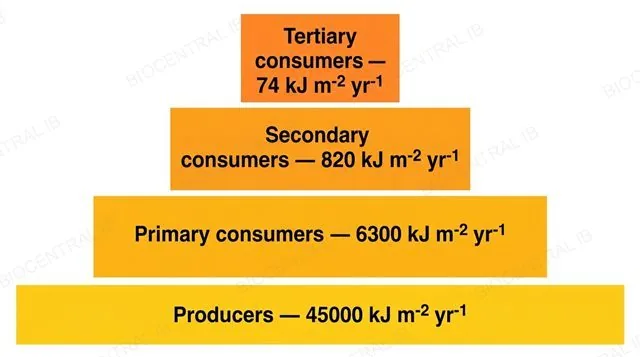
A pyramid of energy shows energy transfer and loss between trophic levels using bars whose width is proportional to the actual value at each level, from real research data.
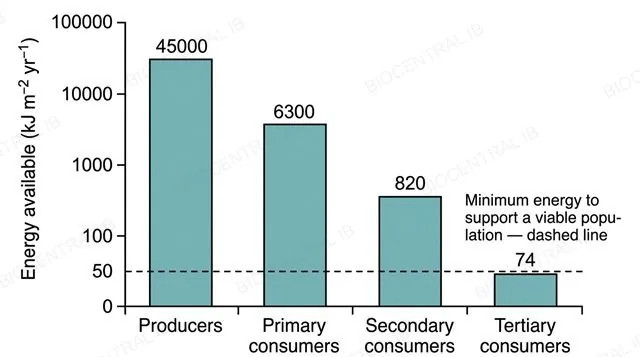
  • Producers form the widest bar at the base; one grassland dataset gives 45,000 kJ m⁻² yr⁻¹, falling to 6,300 for primary consumers, 820 for secondary, and 74 for tertiary consumers.
  • Because this is a quantitative diagram, not a sketch, each bar's width must actually reflect its numeric value, communicating the scale of loss at a glance.
  • Unlike biomass or numbers pyramids, an energy pyramid is never inverted: heat lost at each transfer guarantees a decreasing total up the chain.
Why it mattersA biomass or numbers pyramid can invert momentarily; the underlying energy pyramid never can.
A flat pyramid of energy made of four stacked horizontal bars, widest at the bottom, labeled tertiary consumers 74 kJ per square metre per year, secondary consumers 820, primary consumers 6300, producers 45000, each bar width proportional to its number
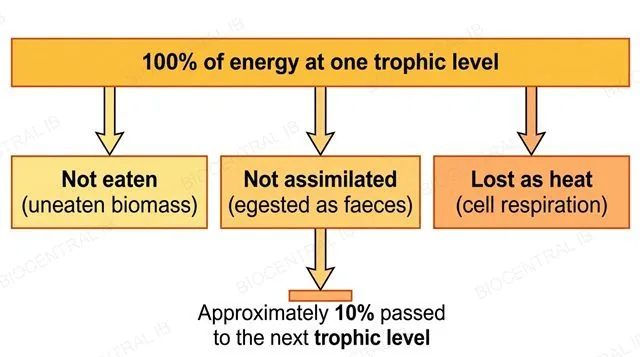
A flat diagram of a bar labeled 100 percent of energy at one trophic level with three downward arrows to boxes labeled not eaten uneaten biomass, not assimilated egested as faeces, and lost as heat cell respiration, converging down to a small final bar labeled approximately 10 percent passed to the next trophic level
C4.2.12

Three leaks, one ~10% left

Only a small fraction of energy at one trophic level transfers to the next, due to three combined causes of loss.
  • Not all available biomass is eaten (roots, bones and other parts are often left); of what is eaten, not all is assimilated — some is egested as faeces.
  • Of the energy that is assimilated, a large share is lost as heat during the consumer's own cell respiration, rather than stored as new biomass.
  • These three losses compound at every transfer, which is why roughly 90% of available energy disappears between one trophic level and the next.
Why it mattersA one-word answer like "energy is lost" scores poorly — naming the three specific causes (uneaten, egested, respired) is what this statement actually assesses.
C4.2.13

Heat escapes twice, not once

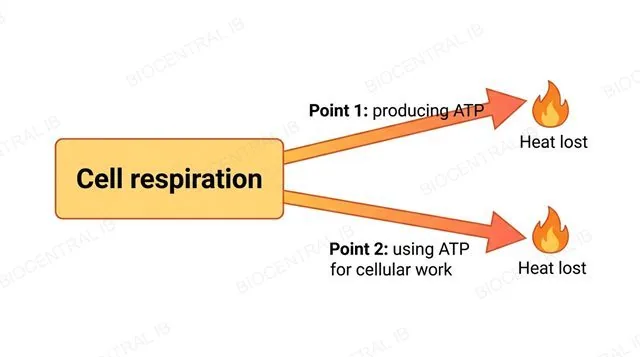
Both autotrophs and heterotrophs lose energy as heat at two separate points, because no biological energy conversion during cell respiration is 100% efficient.
  • The first point of heat loss is during ATP production itself, as chemical energy in carbon compounds converts into the chemical energy stored in ATP.
  • The second, separate point occurs afterward, when that ATP is used to power cellular work elsewhere in the cell.
  • Because this applies in autotrophs as well as heterotrophs, heat loss from respiration is universal and unavoidable, not a special property of animals.
Why it mattersNaming both points — producing ATP and using ATP — rather than a single vague "energy is lost as heat," is what separates a full-mark answer here.
A flat diagram of a box labeled cell respiration with two outward arrows each ending in a flame icon labeled heat lost, one arrow labeled point 1 producing ATP and one arrow labeled point 2 using ATP for cellular work
A flat bar chart with a logarithmic energy axis and four bars labeled producers 45000, primary consumers 6300, secondary consumers 820, tertiary consumers 74 kJ per square metre per year, with a dashed horizontal reference line labeled minimum energy to support a viable population and no bar shown for a fifth trophic level
C4.2.14

Why food chains run out of levels

The number of trophic levels in a food chain is restricted because energy losses at each stage leave progressively less energy to support organisms further up the chain.
  • In the same grassland dataset, tertiary consumers hold only 74 kJ m⁻² yr⁻¹ — a fifth level, at a similar transfer rate, would get far too little to sustain a viable population.
  • Each stage typically has fewer or smaller organisms, so less biomass — but the energy content per unit mass of what remains is not reduced.
  • This is a genuinely energetic limit, not one on species diversity, predator behaviour, or digestive capacity.
Why it mattersMost food chains in this course rarely exceed four or five trophic levels for exactly this reason, not by coincidence.
C4.2.15

Measuring how fast life builds up

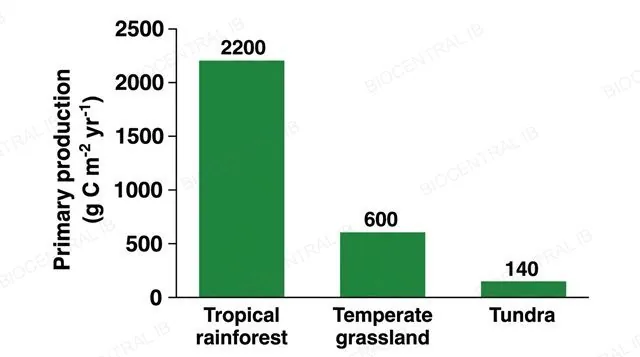
Primary production is the accumulation of carbon compounds in biomass by autotrophs, expressed as mass of carbon per unit area per unit time (g C m⁻² yr⁻¹).
  • Standardizing to area and time lets ecologists compare different ecosystems fairly — tropical rainforest's roughly 2,200 g C m⁻² yr⁻¹ dwarfs tundra's roughly 140, reflecting far more light, warmth and water.
  • Biomass accumulates when autotrophs grow or reproduce — production is a rate of ongoing accumulation, not a single fixed total measured once.
  • Biomes vary enormously in this capacity, tracing back to how much light, water and warmth drives photosynthesis over a season.
Why it mattersReporting production without area and time units is effectively meaningless for comparison — the units are part of the definition.
A flat bar chart with a numeric y-axis labeled primary production in grams carbon per square metre per year and three bars labeled tropical rainforest about 2200, temperate grassland about 600, tundra about 140, each bar showing its exact value above it
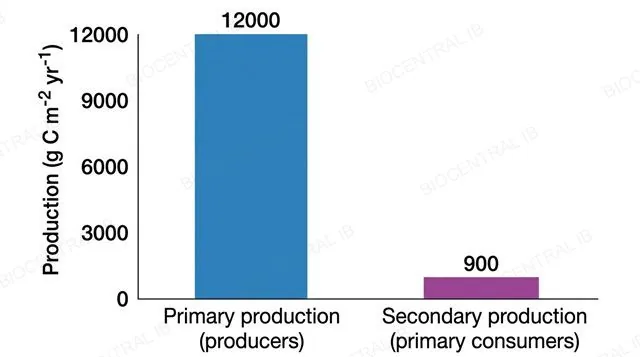
A flat bar chart with a numeric y-axis labeled production in grams carbon per square metre per year and two bars, primary production producers 12000 and secondary production primary consumers 900, each bar showing its exact value above it
C4.2.16

Consumers build biomass more slowly

Secondary production is the accumulation of carbon compounds in biomass by heterotrophs, and it is always lower than the primary production supporting it.
  • A large share of the carbon compounds a heterotroph consumes converts to CO2 and water during its own respiration, rather than becoming new biomass.
  • In one dataset, gross primary production of 12,000 g C m⁻² yr⁻¹ supports only about 900 g C m⁻² yr⁻¹ of consumer secondary production — an expected gap, not a measurement error.
  • This gap reflects the same respiratory loss behind the steep drop at every energy-pyramid step, seen here in carbon and biomass instead of energy.
Why it mattersA large primary-to-secondary gap is normal in every real ecosystem — never a sign something was measured wrong.
Quick check

In a lake ecosystem, producers fix 45,000 kJ m⁻² yr⁻¹, primary consumers have about 6,300, and secondary consumers have about 820 available — each transfer being roughly 10% efficient. A population of apex predators at a fourth trophic level needs at least 900 kJ m⁻² yr⁻¹ to remain viable. Could this lake support them?

No — at roughly 10% efficiency, tertiary consumers would have only about 82 kJ m⁻² yr⁻¹ available, far below the 900 kJ m⁻² yr⁻¹ needed
Yes, because total biomass always increases at higher trophic levels
Yes, because energy content per unit mass increases at higher trophic levels
It's impossible to estimate without knowing the exact species involved
Correct answer: no — the energy available keeps shrinking by roughly 90% at every transfer. This is the restriction on trophic levels from C4.2.14: cumulative energy loss leaves nowhere near enough energy to sustain a further trophic level.
Part four

The carbon cycle, sinks, sources and recycling

C4.2.17 – C4.2.22
C4.2.17 · Skills

Drawing carbon's loop

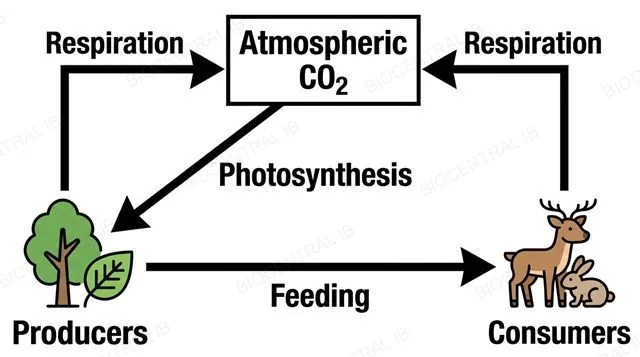
A carbon cycle diagram illustrates how carbon is recycled in ecosystems through three linked processes: photosynthesis, feeding, and respiration.
  • Photosynthesis draws atmospheric CO2 into producer biomass as organic carbon compounds; feeding then transfers that carbon along a food chain from producer to consumer.
  • Respiration, in both autotrophs and heterotrophs, returns carbon back to the atmosphere as CO2, completing the loop and making it available for photosynthesis again.
  • Unlike energy, which enters an ecosystem once and eventually leaves as heat, carbon genuinely cycles — the same atoms are used, released and reused indefinitely.
Why it mattersThis three-process loop directly answers this lesson's first guiding question: why matter, unlike energy, can be recycled in ecosystems.
A flat diagram with a central box labeled atmospheric CO2 and four arrows, one to producers labeled photosynthesis, one from producers to consumers labeled feeding, and two arrows labeled respiration returning from producers and from consumers back to the atmosphere box
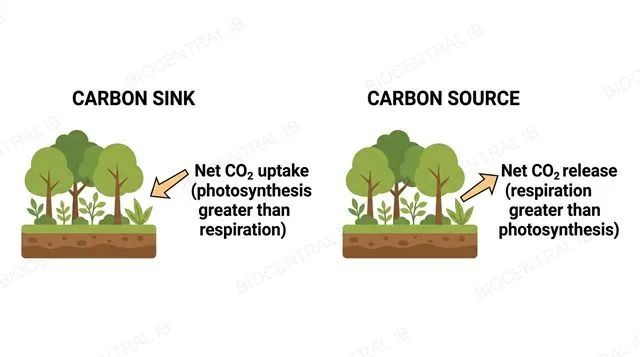
A flat two-panel diagram, left panel carbon sink with an inward arrow labeled net CO2 uptake photosynthesis greater than respiration, right panel carbon source with an outward arrow labeled net CO2 release respiration greater than photosynthesis
C4.2.18 · C4.2.19

When an ecosystem tips the balance

An ecosystem is a carbon sink when photosynthesis exceeds respiration (net CO2 uptake), and a source when respiration exceeds photosynthesis (net release).
  • Combustion adds a separate, one-way release: burning biomass, peat, coal, oil or gas returns CO2 fixed years ago (biomass) or hundreds of millions of years ago (fossil fuels).
  • Natural combustion (lightning-triggered wildfire) has always occurred, but burning fossil fuels and clearing forests has massively increased the rate carbon is released.
  • Because combustion releases long-stored carbon essentially at once, it pushes an ecosystem, or the planet, toward acting as a net source.
Why it mattersDistinguishing a temporary sink/source shift from combustion's one-way release of ancient carbon matters for reading the Keeling Curve, next.
C4.2.20

A yearly breath, visible in the data

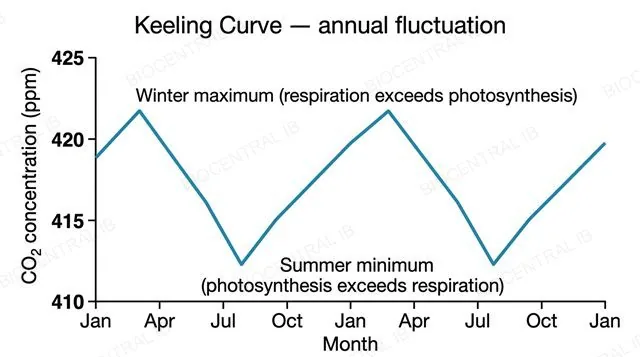
The Keeling Curve's annual fluctuation shows atmospheric CO2 falling each year as photosynthesis outpaces respiration, then rising again as respiration outpaces it.
  • CO2 dips to a summer minimum, around 412 ppm, when Northern Hemisphere plant growth peaks and photosynthesis draws down the most carbon.
  • CO2 climbs to a winter maximum, around 422 ppm, as growth slows and respiration — by plants, animals and decomposers — again exceeds photosynthesis.
  • Because most land and plant biomass sits in the Northern Hemisphere, its growing season dominates the whole planet's annual CO2 rhythm.
Why it mattersThis annual zigzag is direct, real-world evidence of the same photosynthesis/respiration balance behind the sink/source idea just introduced.
A flat line graph titled Keeling Curve annual fluctuation with a numeric x-axis of months across two years and a numeric y-axis of CO2 concentration in ppm from 410 to 425, a zigzag line with a labeled summer minimum around 412 ppm and a labeled winter maximum around 422 ppm
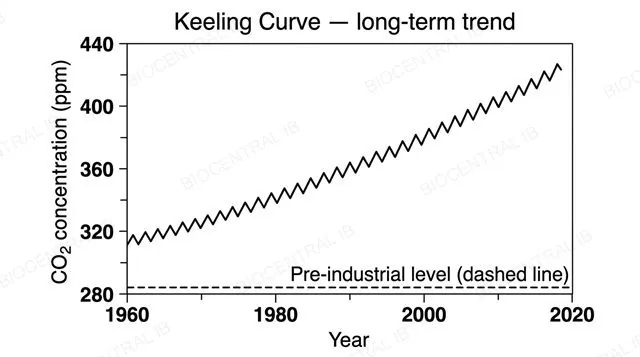
A flat line graph titled Keeling Curve long-term trend with a numeric x-axis of years from 1960 to 2020 and a numeric y-axis of CO2 concentration in ppm from 280 to 440, a rising line from about 315 ppm in 1960 to about 425 ppm in 2020 with small annual zigzags, and a dashed horizontal reference line at 280 ppm labeled pre-industrial level
C4.2.20

The rise underneath the wiggle

Beneath its annual zigzag, the Keeling Curve's long-term trend shows atmospheric CO2 rising steadily, from around 315 ppm in 1960 to roughly 425 ppm today.
  • The pre-industrial level, near 280 ppm, sits well below even the curve's earliest recorded values — the rise was already underway before measurement began in 1958.
  • This long-term rise is attributed largely to combustion, especially of fossil fuels, outpacing the rate photosynthesis and other sinks can remove the extra CO2.
  • The smaller annual zigzags still ride on top of this trend, but the trend itself signals a genuine, sustained global sink-to-source shift.
Why it mattersReading this graph means separating the predictable annual wiggle from the underlying trend — an exam question can ask about either one separately.
C4.2.21

Two processes, each other's supplier

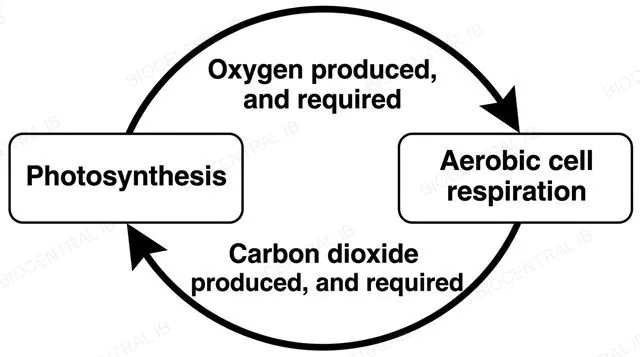
Aerobic respiration depends on atmospheric oxygen produced by photosynthesis, and photosynthesis depends on atmospheric carbon dioxide produced by respiration — a two-way interaction.
  • Photosynthesis releases O2 while fixing CO2; aerobic respiration then consumes that O2 while releasing CO2 back — each process supplies what the other needs.
  • The fluxes of both gases through this exchange each year are enormous, making it one of the largest interactions between autotrophs and heterotrophs on the planet.
  • This dependence is genuinely mutual: it isn't simply photosynthesis "helping" respiration, since respiration's CO2 is equally necessary to keep photosynthesis supplied.
Why it mattersThis mutual gas exchange is why widespread deforestation or ocean warming, which disrupt photosynthetic output, ultimately affect the atmosphere available to every respiring organism, not only plants.
A flat diagram with two boxes, photosynthesis and aerobic cell respiration, connected by two curved arrows forming a cycle, one labeled oxygen produced and required and one labeled carbon dioxide produced and required
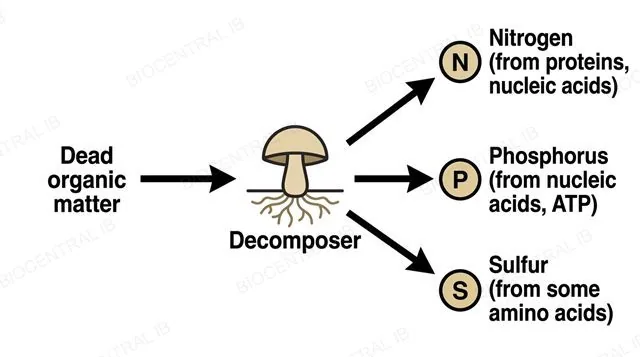
A flat diagram with a central decomposer fungus icon, one inward arrow labeled dead organic matter, and three outward arrows to labeled elements, nitrogen from proteins and nucleic acids, phosphorus from nucleic acids and ATP, sulfur from some amino acids
C4.2.22

Not just carbon comes back around

Every chemical element required by living organisms — not only carbon — is recycled within ecosystems, with decomposers again playing a central role.
  • Breaking down dead matter releases nitrogen (from proteins, nucleic acids), phosphorus (from nucleic acids, ATP), and sulfur (from some amino acids), all available for producers again.
  • This course doesn't require the detailed mechanism of the nitrogen cycle or any nutrient cycle — only that all such elements are recycled.
  • The same open-system logic from earlier applies here too: elements exit one organism and re-enter the ecosystem's available pool rather than disappearing.
Why it mattersThis generalizes the lesson's second guiding question — how lost material, not just energy, gets replaced — beyond carbon to every element life depends on.

Key vocabulary

Worth being able to define in a single sentence each

Ecosystem
A community of organisms and their physical environment, functioning as an open system exchanging both energy and matter.
Autotroph
An organism that uses an external energy source to fix carbon dioxide into the organic carbon compounds it needs.
Heterotroph
An organism that obtains carbon compounds from other organisms and uses them to build its own required compounds.
Trophic level
An organism's feeding position in a specific food chain — producer, primary, secondary or tertiary consumer.
Primary production
The rate at which autotrophs accumulate carbon compounds in biomass, expressed in g C m⁻² yr⁻¹.
Secondary production
The rate at which heterotrophs accumulate carbon compounds in biomass — always lower than primary production.
Carbon sink
A system where photosynthesis exceeds respiration, giving a net uptake of atmospheric CO2.
Carbon source
A system where respiration or combustion exceeds photosynthesis, giving a net release of CO2.
Decomposer
A heterotroph that obtains energy from dead organic matter, releasing heat and recycling inorganic nutrients.

Where this shows up again

C1.2 · Cell respiration
Cell respiration (C1.2) is the process by which both autotrophs and heterotrophs release energy from carbon compounds, and its inefficiency is the direct cause of heat loss and reduced energy availability between trophic levels. Explain this connection.
C1.3 · Photosynthesis
Photosynthesis (C1.3) is the entry point for both carbon and energy into most ecosystems. Explain how the biochemistry of photosynthesis sets an upper limit on primary production and, ultimately, on the total energy available to consumers.
C4.1 · Populations and communities
Food webs and trophic level classification (C4.2.4, C4.2.10) build directly on the populations and communities studied in C4.1 — for example predator-prey relationships and interspecific competition occur between organisms that also occupy specific trophic levels. Explain how energy flow constrains the structure of the communities described in C4.1.
D4.3 · Climate change
Rising atmospheric CO2, tracked by the Keeling Curve (C4.2.20), is a major driver of climate change (D4.3). Explain how disruption of the carbon sink/source balance described in this topic contributes to the enhanced greenhouse effect.

C4.2 Transfers of energy and matter — one-page recap

Screenshot this slide to revise from

Open systems & energy flow
  • Ecosystems are open systems: energy and matter both cross the boundary; sunlight is the principal, but not only, energy source (a scientific law, with cave/deep-ocean exceptions).
  • Chemical energy flows one-way through food chains/webs; decomposers recycle dead matter's remaining energy and nutrients.
Autotrophs & heterotrophs
  • Autotrophs fix CO2 using light (photoautotrophs) or oxidation reactions (chemoautotrophs) — both energy-requiring.
  • Heterotrophs digest others' carbon compounds and reassemble them; both groups respire, losing heat twice (making and using ATP).
Trophic levels & pyramids
  • Trophic level depends on the food chain considered; pyramids of energy are drawn to scale and never invert.
  • Roughly 90% of energy is lost at each transfer (uneaten, egested, respired), restricting food chains to a handful of levels.
Production
  • Primary production = autotroph biomass accumulation (g C m⁻² yr⁻¹); secondary production = heterotroph biomass accumulation, always lower.
  • Biomes vary hugely in primary production, driven mainly by light, warmth and water availability.
Carbon cycle & balance
  • Carbon cycles via photosynthesis, feeding and respiration; an ecosystem is a sink or source depending which process dominates.
  • Combustion releases long-stored carbon; the Keeling Curve shows an annual wiggle riding on a rising long-term trend.
Recycling & interdependence
  • Photosynthesis and respiration are mutually dependent, exchanging O2 and CO2 in huge annual fluxes.
  • All elements life needs — not just carbon — are recycled by decomposers, including nitrogen, phosphorus and sulfur.

Energy leaves. Carbon comes back.

From a single sunbeam fixed by a leaf to the last watt lost as heat four trophic levels later, and from that same carbon released by respiration to a producer that fixes it again — this is the difference between a resource spent once and a resource used forever.
C4.2 Transfers of energy and matter · BioCentral IB
Use ↓ ↑ or click to navigate
01 / 20