BioCentral IBBioCentral IB
IB Biology · Theme D · D3.2

Inheritance

Inheritance is the passing of alleles from parents to offspring through gametes. This topic follows one gene from the gamete to the phenotype, through dominance, multiple alleles, sex linkage and pedigrees, to continuous variation and box plots, and at HL goes on to dihybrid crosses, gene linkage and the chi-squared test.
Guiding questions

What patterns of inheritance exist in plants and animals?

What is the molecular basis of inheritance patterns?

Part one

From gametes to phenotype

D3.2.1 – D3.2.6
D3.2.1

Haploid gametes fuse to make a diploid zygote

Inheritance happens through haploid gametes made in the parents, which fuse to form a diploid zygote.
  • A diploid body cell has two copies of each autosomal gene, while a gamete made by meiosis has only one.
  • At fertilization one gamete from each parent fuses, so the zygote gets one allele from its mother and one from its father for every autosomal gene.
  • This pattern of inheritance is common to all eukaryotes with a sexual life cycle.
Why it mattersEvery offspring genotype is built from exactly two gametes.
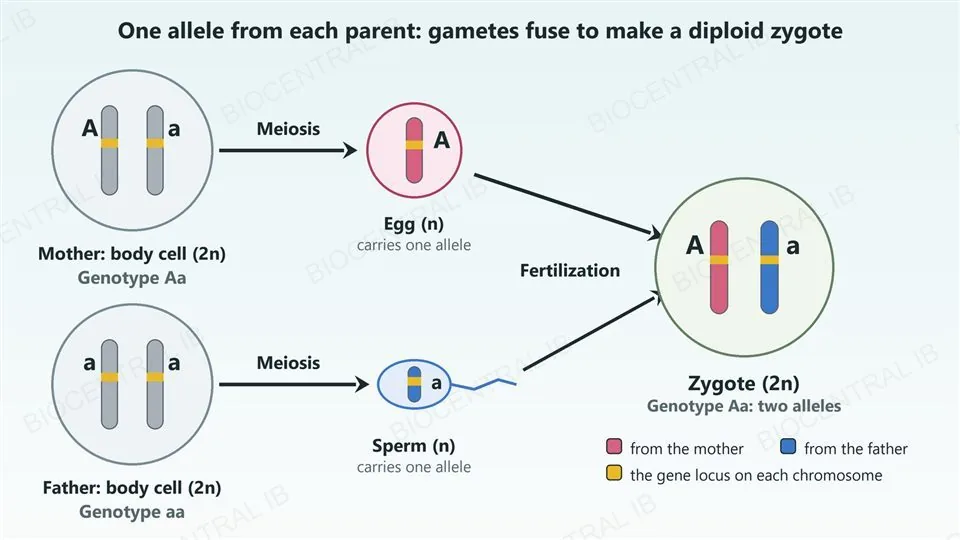
A diagram of one gene. The mother has genotype Aa and her body cell has two homologous chromosomes carrying A and a; meiosis gives an egg with one chromosome carrying A. The father has genotype aa and meiosis gives a sperm carrying a. Fertilization joins them into a zygote with two chromosomes, a pink one carrying A from the mother and a blue one carrying a from the father, so its genotype is Aa.
D3.2.2

A genetic cross needs pollination

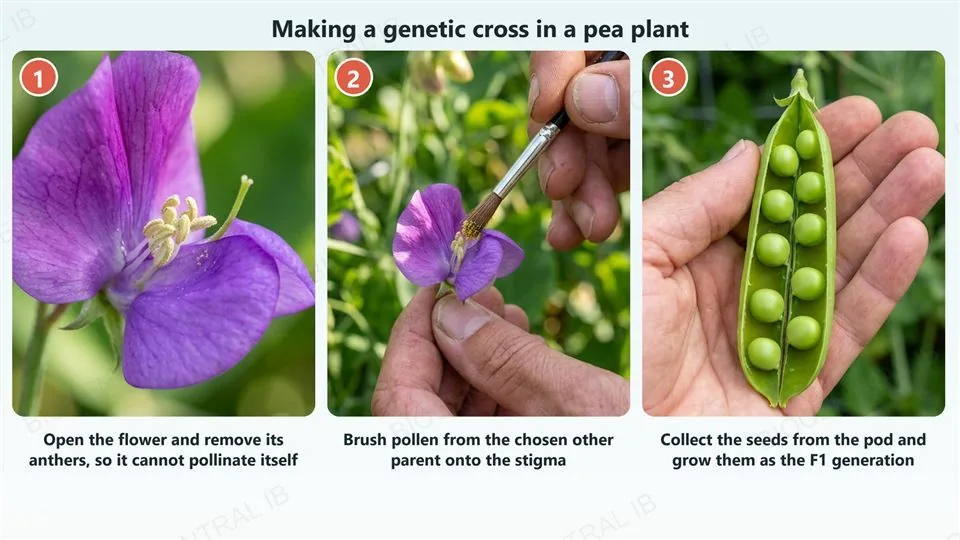
In flowering plants pollen contains the male gametes and the female gametes are in the ovary, so pollination is needed to carry out a cross.
  • Peas make both male and female gametes on the same plant, so they can self-pollinate and therefore self-fertilize.
  • To make a cross, the anthers of the seed parent are removed and pollen from the chosen parent is brushed onto its stigma.
  • Genetic crosses are widely used to breed new varieties of crop or ornamental plants.
Why it mattersControlling which pollen reaches which stigma is what makes a cross a controlled experiment.
Three photographs of making a cross in a pea plant. 1: a purple pea flower opened to show its anthers and style, which is the flower whose anthers are removed so it cannot pollinate itself. 2: a hand brushing pollen from a fine paintbrush onto another purple pea flower. 3: a hand holding an open green pea pod showing a row of round peas, the seeds that are grown as the F1 generation.
D3.2.2

P, F1, F2 and the Punnett grid

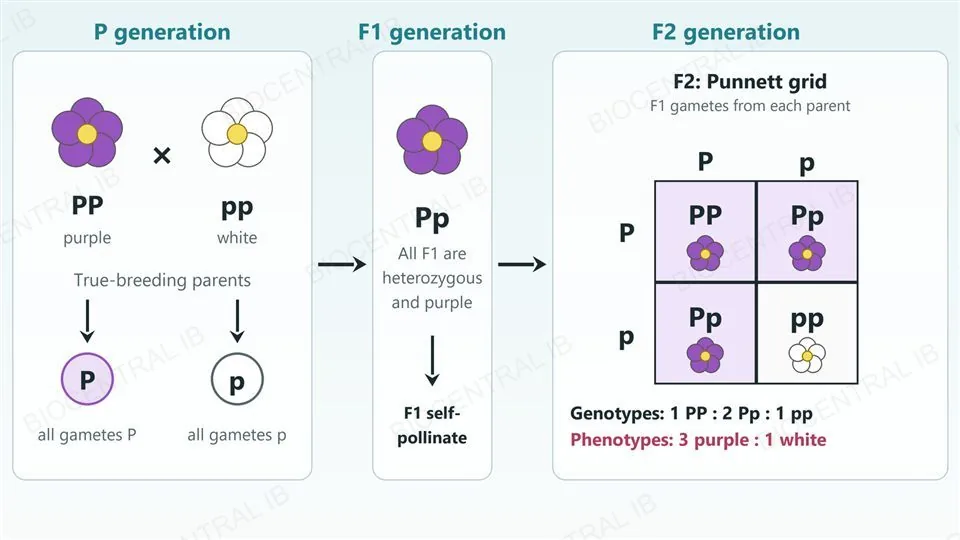
A cross starts with the P generation, their offspring are the F1 generation, and crossing F1 individuals gives the F2 generation.
  • A Punnett grid combines every possible gamete from each parent to show the possible offspring genotypes.
  • True-breeding purple (PP) and white (pp) parents give an F1 that is all Pp and all purple.
  • Crossing two F1 plants gives an F2 with genotypes 1 PP : 2 Pp : 1 pp, which is a phenotypic ratio of 3 purple : 1 white.
Why it mattersThe 3 : 1 ratio appears because each F1 parent makes two kinds of gamete in equal numbers.
Three columns. P generation: a purple flower PP crossed with a white flower pp, each making one kind of gamete, P or p. F1 generation: one purple flower Pp, all F1 plants are heterozygous and purple, and they self-pollinate. F2 generation: a two by two Punnett grid with gametes P and p on each side giving PP, Pp, Pp and pp, with the ratio of genotypes 1 PP : 2 Pp : 1 pp and of phenotypes 3 purple : 1 white.
D3.2.3

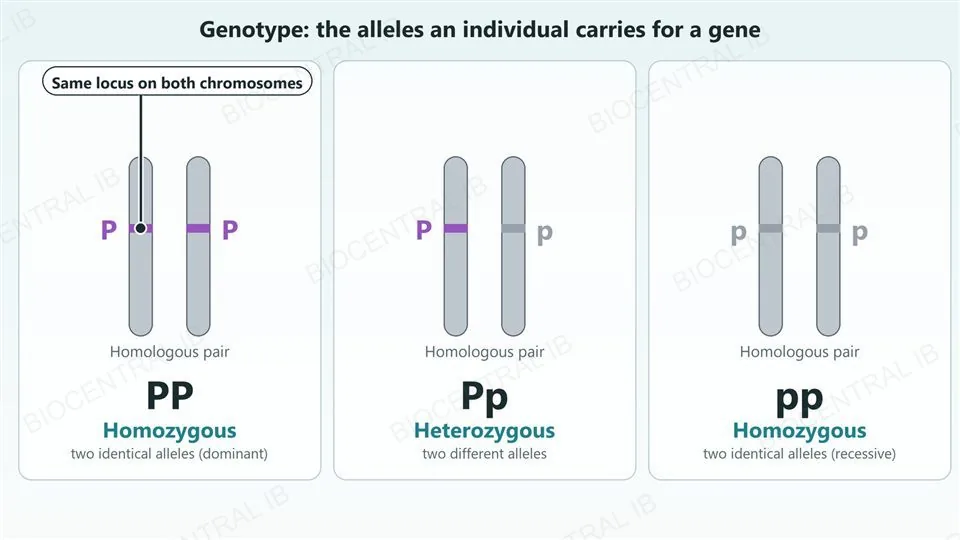
Genotype is the combination of alleles an organism inherits

The genotype of an organism is the combination of alleles that it has inherited for a gene.
  • A gene is a section of DNA at a particular locus on a chromosome, and alleles are the different versions of that gene.
  • An organism with two identical alleles, such as PP or pp, is homozygous.
  • An organism with two different alleles, such as Pp, is heterozygous.
Why it mattersGenes and alleles are not the same thing: one gene can have several alleles.
Three cards each showing a pair of homologous chromosomes with a coloured band at the same locus and an allele beside each band. PP has a purple P on both chromosomes and is homozygous, with two identical dominant alleles. Pp has a purple P on one and a grey p on the other and is heterozygous, with two different alleles. pp has a grey p on both and is homozygous, with two identical recessive alleles.
D3.2.4

Phenotype comes from genotype and environment

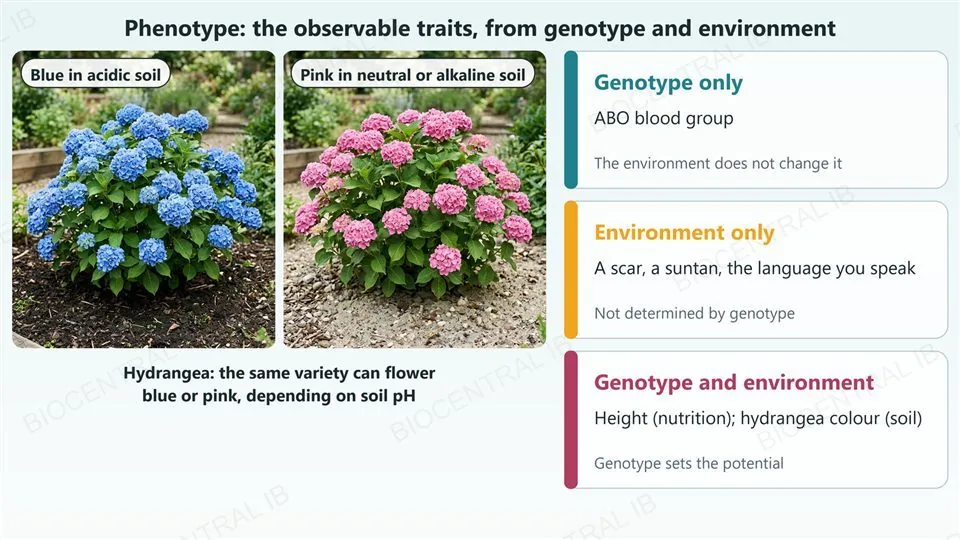
The phenotype of an organism is its observable traits, and it results from its genotype and from environmental factors.
  • Some human traits are due to genotype only, such as ABO blood group.
  • Some are due to environment only, such as a scar, a suntan or the language a person speaks.
  • Many are due to an interaction: height depends on genes and on nutrition, and hydrangea flowers are blue in acidic soil and pink in neutral or alkaline soil.
Why it mattersThe same genotype can give different phenotypes in different environments.
Left, two photographs of hydrangea shrubs of the same kind: one with blue flower heads in dark acidic soil and one with pink flower heads in pale neutral or alkaline soil. Right, three cards: genotype only (ABO blood group, not changed by the environment); environment only (a scar, a suntan, the language you speak, not determined by genotype); genotype and environment (height depends on nutrition, hydrangea colour depends on soil, and genotype sets the potential).
D3.2.5

One dominant allele is enough to show the dominant phenotype

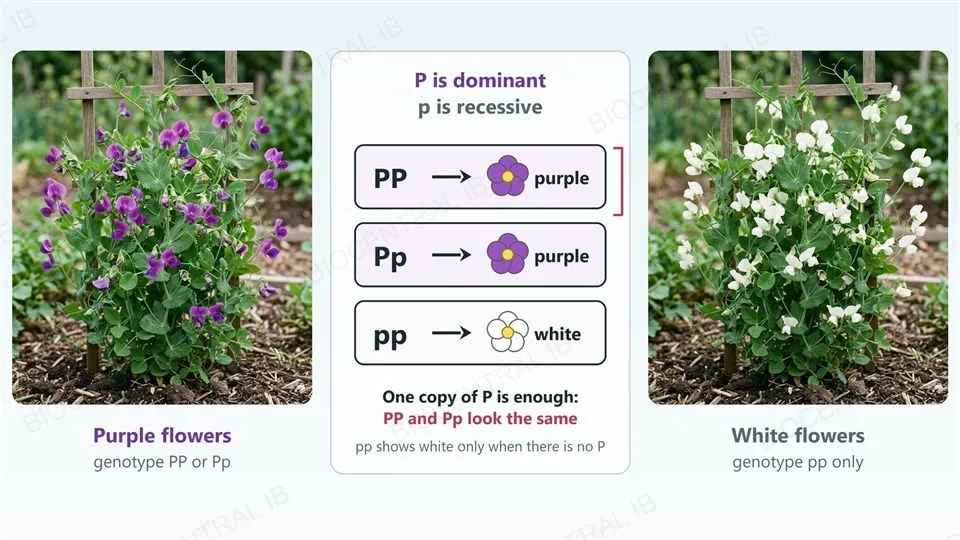
A dominant allele has the same effect on the phenotype whether an individual is homozygous or heterozygous for it, while a recessive allele has an effect only in a homozygote.
  • PP and Pp plants both have purple flowers, because one copy of the dominant allele is enough.
  • In Pp the recessive allele is present, but its effect is hidden.
  • Only pp plants, with no dominant allele at all, have white flowers.
Why it mattersYou cannot tell PP from Pp by looking, so a cross is needed to find out.
Two photographs of pea plants on garden trellises, one covered in purple flowers labelled genotype PP or Pp and one covered in white flowers labelled genotype pp. Between them a card says P is dominant and p is recessive and lists PP gives purple, Pp gives purple and pp gives white, with a bracket showing that PP and Pp look the same.
D3.2.6

Phenotypic plasticity: gene expression changes, the DNA does not

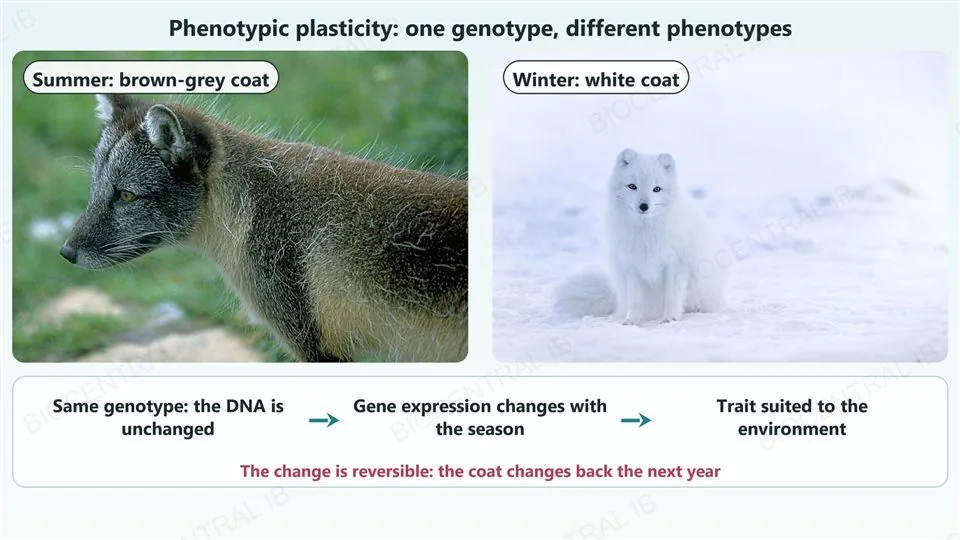
Phenotypic plasticity is the capacity to develop traits suited to the environment that an organism experiences, by varying patterns of gene expression.
  • The genotype does not change, so plasticity is not due to mutation.
  • An Arctic fox has a brown-grey coat in summer and a white coat in winter, each suited to the background at that time of year.
  • The changes in traits may be reversible during the lifetime of an individual.
Why it mattersA plastic trait is the same genes being used differently, not different genes.
Two photographs of Arctic foxes: on the left one in its summer coat, brown and grey against green grass, and on the right one in its white winter coat sitting in snow. A caption row says the same genotype with the DNA unchanged leads to gene expression changing with the season, giving a trait suited to the environment, and that the change is reversible because the coat changes back the next year.
Photos: Andreas Tille, CC BY-SA 4.0 · Jonatan Pie, CC0 · Wikimedia Commons
Part two

Patterns of inheritance

D3.2.7 – D3.2.10
D3.2.7

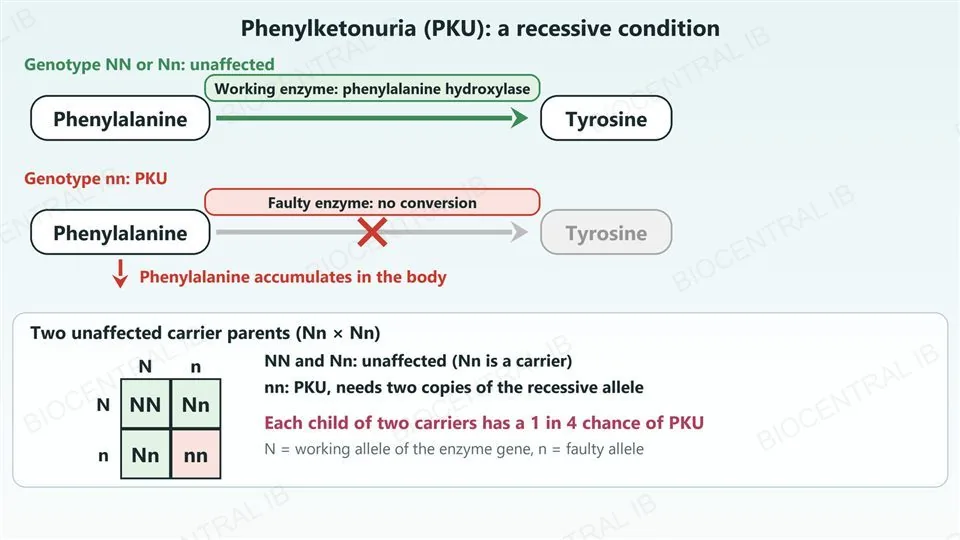
PKU: a recessive condition caused by a faulty enzyme

Phenylketonuria (PKU) is a recessive genetic condition caused by a mutation in an autosomal gene.
  • The gene codes for the enzyme that converts phenylalanine to tyrosine, so without a working enzyme phenylalanine builds up in the body.
  • Only homozygous recessive individuals (nn) have PKU, because one working allele is enough to make the enzyme.
  • Two unaffected carriers (Nn) have a 1 in 4 chance of an affected child at each birth.
Why it mattersPKU shows how a recessive allele leads, through a missing enzyme, to a disease phenotype.
Top, two pathways. With genotype NN or Nn a working enzyme, phenylalanine hydroxylase, converts phenylalanine to tyrosine. With genotype nn the enzyme is faulty, the arrow to tyrosine is crossed out and phenylalanine accumulates in the body. Bottom, a Punnett grid of two carrier parents Nn by Nn giving NN, Nn, Nn and nn: nn has PKU, so there is a 1 in 4 chance of an affected child.
D3.2.8

Many alleles can exist in a gene pool, but a person has two

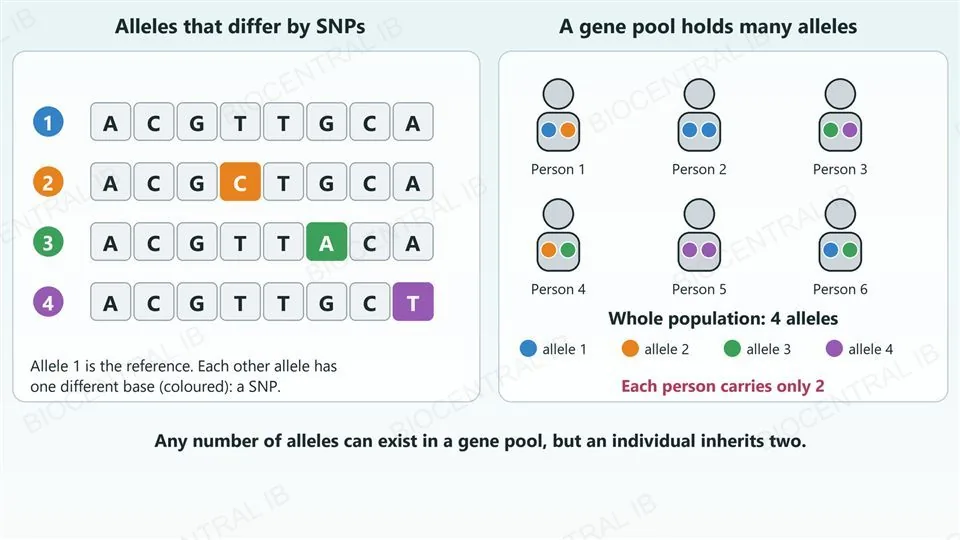
A single-nucleotide polymorphism (SNP) is a difference of one base in the DNA sequence, and SNPs are one source of the alleles found in gene pools.
  • A gene pool is all the genes and their different alleles in a population.
  • Any number of alleles of a gene can exist in the gene pool.
  • An individual inherits only two of them, one from each parent.
Why it mattersA population holds far more variation than any one person can carry.
Left, four short DNA sequences ACGTTGCA numbered 1 to 4. Allele 1 is the reference and each other allele has one changed base shown in colour: allele 2 has C at position 4, allele 3 has A at position 6, allele 4 has T at position 8. Right, six people each carrying two coloured dots for two alleles, and a summary that the whole population has 4 alleles while each person carries only 2.
D3.2.9

ABO blood groups: three alleles, four groups

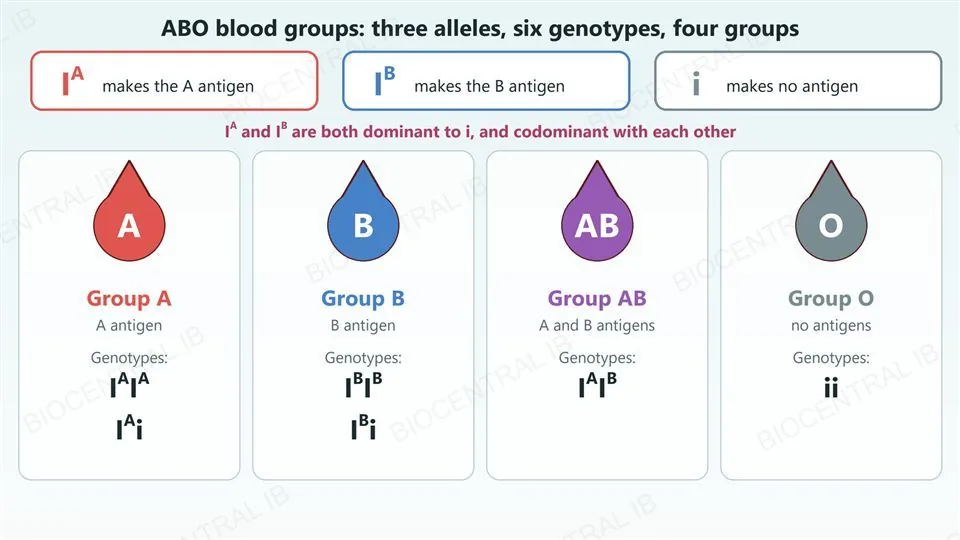
The ABO blood group gene is an example of multiple alleles, written IA, IB and i.
  • IA and IB are both dominant to i, so IAIA and IAi give group A, and IBIB and IBi give group B.
  • IAIB gives group AB, because the two alleles are codominant.
  • ii gives group O.
Why it mattersSix genotypes give four phenotypes.
Three allele boxes: I A makes the A antigen, I B makes the B antigen, i makes no antigen; I A and I B are both dominant to i and codominant with each other. Below, four blood-drop cards. Group A has genotypes I A I A and I A i; group B has I B I B and I B i; group AB has I A I B; group O has ii.
D3.2.10

Incomplete dominance gives an intermediate phenotype

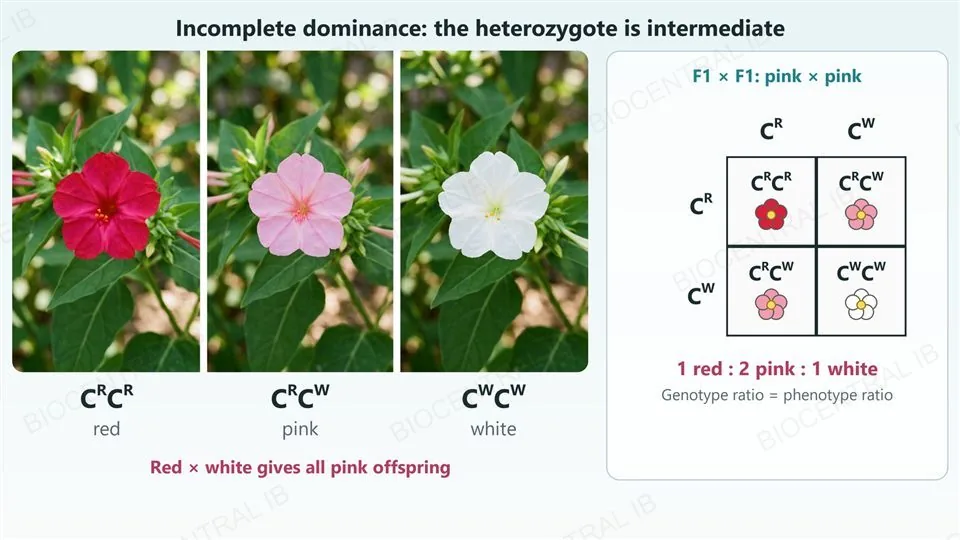
In incomplete dominance the heterozygote has an intermediate phenotype, between those of the two homozygotes.
  • In the four o’clock flower, marvel of Peru (Mirabilis jalapa), red CRCR crossed with white CWCW gives all pink CRCW.
  • Crossing two pink plants gives 1 red : 2 pink : 1 white.
  • The genotype ratio and the phenotype ratio are the same, because each genotype has its own phenotype.
Why it mattersPink is one blended phenotype, not red and white patches.
Three photographs of four o’clock flowers: a red flower labelled C R C R, a pink flower labelled C R C W and a white flower labelled C W C W. Text says red crossed with white gives all pink offspring. Right, a Punnett grid of pink by pink with gametes C R and C W giving one red, two pink and one white flower, a ratio of 1 red : 2 pink : 1 white where the genotype ratio equals the phenotype ratio.
D3.2.10

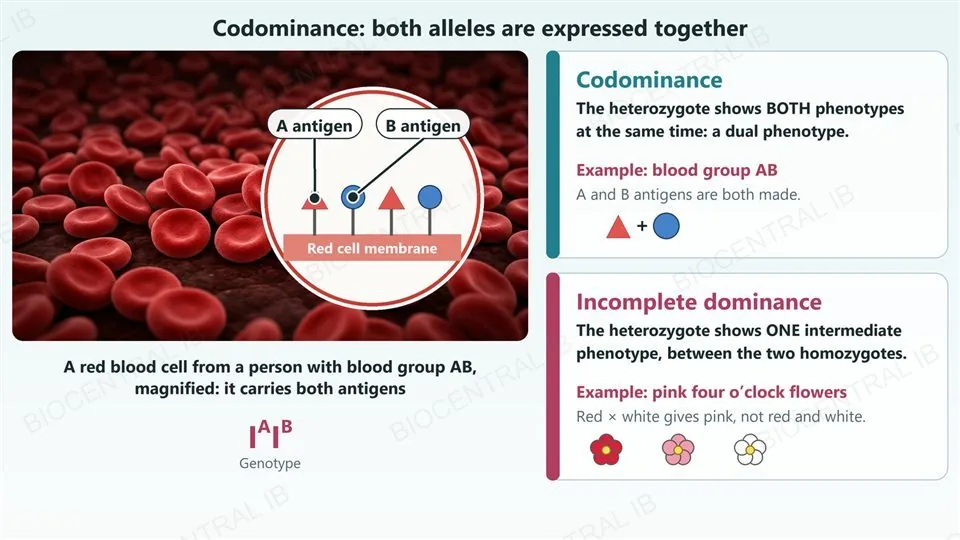
Codominance gives a dual phenotype

In codominance the heterozygote has a dual phenotype, in which both alleles are expressed at the same time.
  • A person with blood group AB (IAIB) makes both the A antigen and the B antigen on the surface of the red blood cells.
  • Neither allele hides the other, and the antigens are not blended.
  • This differs from incomplete dominance, where the heterozygote shows one intermediate trait.
Why it mattersDual means both traits appear; intermediate means one new trait in between.
A photograph-style image of red blood cells with a magnified circle showing the cell membrane with two kinds of antigen sticking out, red triangles labelled A antigen and blue circles labelled B antigen, for a person of blood group AB with genotype I A I B. Right, two cards: codominance, where the heterozygote shows both phenotypes at once, for example blood group AB; and incomplete dominance, where the heterozygote shows one intermediate phenotype, for example pink four o’clock flowers between red and white.
Quick check

A woman who is a carrier of haemophilia (XHXh) and a man without haemophilia (XHY) have a child. What is the probability that the child is a son with haemophilia?

1 in 2
1 in 4
1 in 8
Zero, because only daughters can be affected
Correct answer: 1 in 4. Half of the children are sons (they receive Y from the father), and half of the sons receive the Xh allele from the carrier mother, so 1/2 × 1/2 = 1/4 (D3.2.12). A son has only one X, so one Xh allele is enough to cause haemophilia.

Key vocabulary — genotype and phenotype

D3.2.1 – D3.2.6: worth being able to define each in a sentence

P, F1 and F2
The parental generation, the first filial generation (their offspring) and the second (the offspring of two F1 individuals).
Punnett grid
A table that combines all the possible gametes of two parents to predict offspring genotypes and phenotypes.
Genotype
The combination of alleles that an organism has inherited for a gene.
Phenotype
The observable traits of an organism, resulting from genotype and environmental factors.
Homozygous
Having two identical alleles of a gene.
Heterozygous
Having two different alleles of a gene.
Dominant allele
An allele with the same effect on the phenotype in a homozygote and a heterozygote.
Recessive allele
An allele that has an effect on the phenotype only in a homozygote.
Phenotypic plasticity
The capacity to develop traits suited to the environment, by varying patterns of gene expression.
Part three

Sex linkage, pedigrees and variation

D3.2.11 – D3.2.15
D3.2.11

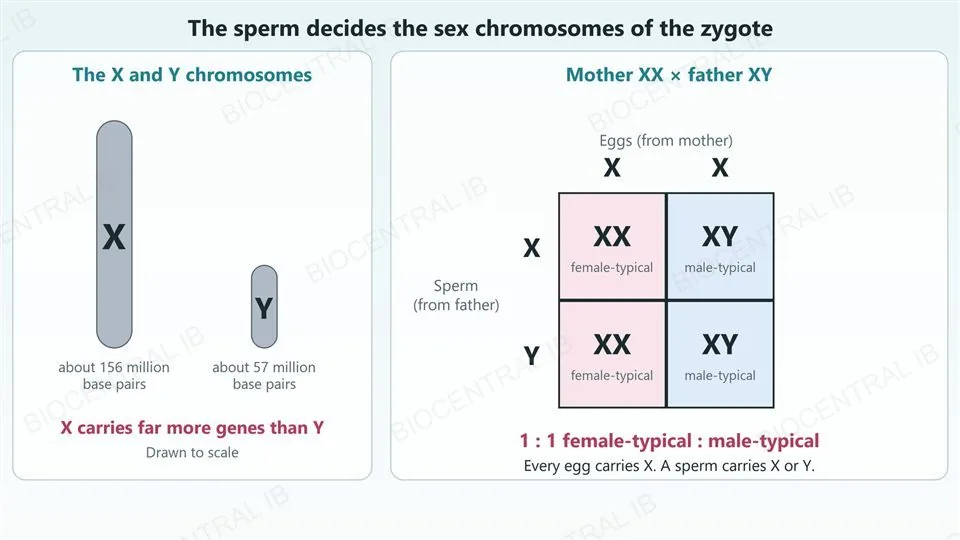
The sperm’s sex chromosome decides the zygote’s sex

In humans the sex chromosome carried by the sperm determines whether the zygote develops male-typical or female-typical physical characteristics.
  • Females have XX and males have XY, so every egg carries an X while a sperm carries either an X or a Y.
  • An X-carrying sperm gives XX and a Y-carrying sperm gives XY, in equal numbers.
  • The X chromosome carries far more genes than the Y chromosome, so most genes on the sex chromosomes are X-linked.
Why it mattersThe father’s gamete decides, and the ratio is 1 : 1.
Left, a large X chromosome and a much smaller Y chromosome drawn to scale, about 156 and 57 million base pairs, with the note that X carries far more genes than Y. Right, a Punnett grid of mother XX by father XY: eggs are both X, sperm are X and Y, and the four offspring are XX, XY, XX and XY, giving female-typical and male-typical zygotes in a 1 : 1 ratio.
D3.2.12

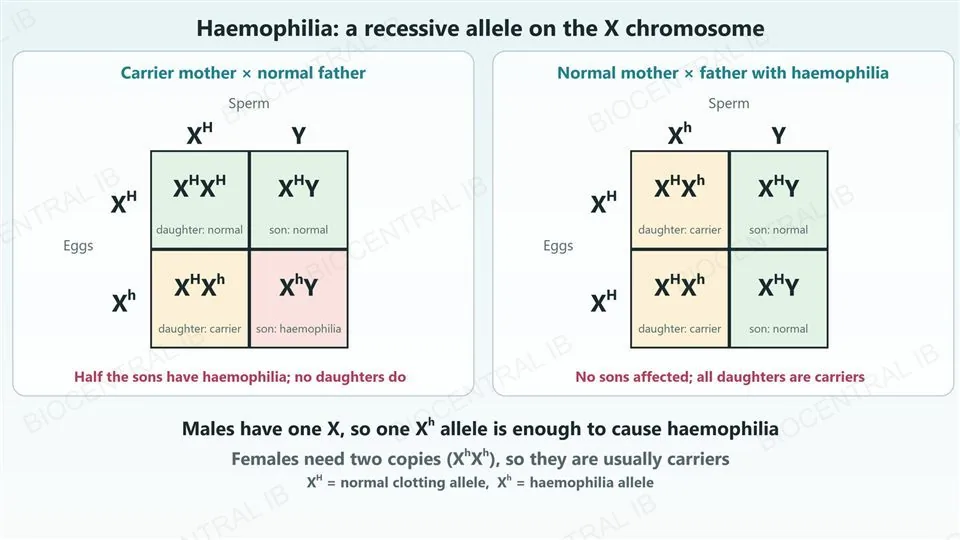
Haemophilia: a sex-linked recessive disorder

Haemophilia is a sex-linked genetic disorder caused by a recessive allele carried on the X chromosome.
  • X-linked alleles are written as superscripts on an uppercase X: XH is the normal allele and Xh the haemophilia allele.
  • A male has one X, so a single Xh (XhY) causes haemophilia.
  • A female needs two copies (XhXh) to be affected, and a heterozygous XHXh female is a carrier.
Why it mattersThis is why sex-linked recessive conditions are more common in males than in females.
Two Punnett grids. Left, a carrier mother X H X h and a normal father X H Y: daughters X H X H normal and X H X h carrier, sons X H Y normal and X h Y with haemophilia, so half the sons are affected and no daughters. Right, a normal mother X H X H and a father with haemophilia X h Y: all daughters X H X h carriers and all sons X H Y normal. A note says males need one X h allele but females need two.
D3.2.13

A pedigree chart follows a disorder through generations

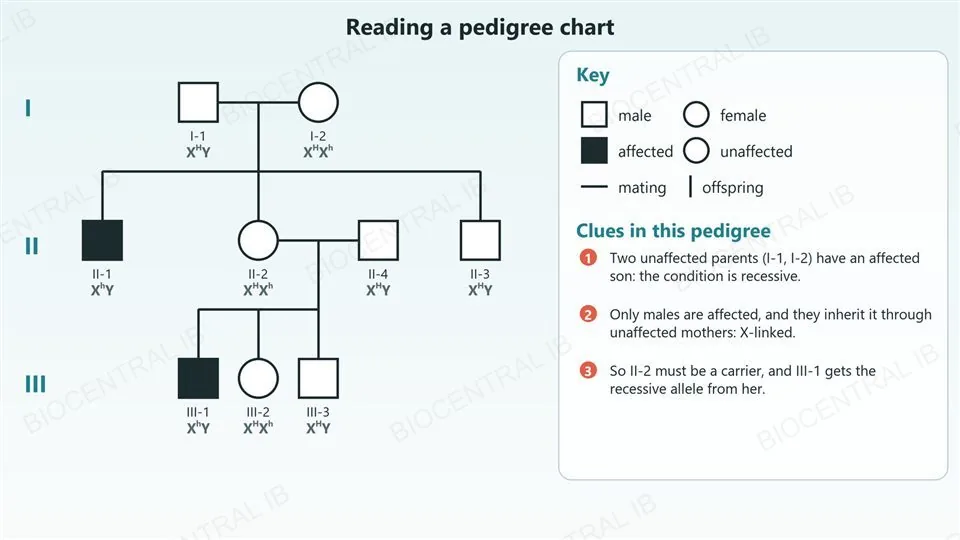
A pedigree chart uses standard symbols to follow a genetic disorder through a family, so that its pattern of inheritance can be deduced.
  • Squares are males and circles are females, filled symbols are affected individuals, and a horizontal line joins a mating pair.
  • Unaffected parents with an affected child show that the allele is recessive.
  • If only males are affected, and they inherit the condition through unaffected mothers, the gene is X-linked.
Why it mattersThe pedigree symbols are given in the data booklet.
A three-generation pedigree chart with generations I, II and III numbered. Two unaffected parents I-1 (square) and I-2 (circle) have three children including an affected son II-1 shown as a filled square. Daughter II-2 and unaffected II-4 have three children including an affected son III-1. A key shows the symbols for male, female, affected, unaffected, mating and offspring, and three clues explain how to deduce that the condition is recessive and X-linked.
D3.2.13

Induction finds the pattern; deduction finds the genotype

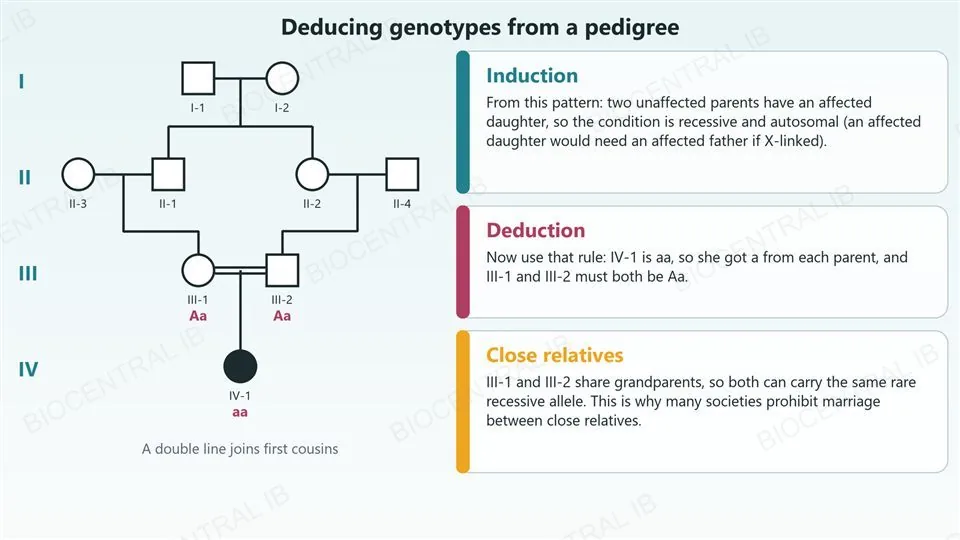
Scientists use inductive reasoning to draw a general conclusion from some observations, and deductive reasoning to apply that conclusion to a particular case.
  • Induction: from part of a pedigree, we conclude that a condition is recessive and autosomal.
  • Deduction: using that pattern, we work out an individual’s genotype, such as two unaffected parents who must both be Aa because their child is aa.
  • Close relatives are more likely to carry the same rare recessive allele from a shared ancestor, the genetic basis for prohibiting marriage between them in many societies.
Why it mattersNature of science: patterns are induced from some cases, then used to deduce others.
A four-generation pedigree chart in which first cousins III-1 and III-2, joined by a double line, have an affected daughter IV-1 shown as a filled circle. IV-1 is labelled aa and both of her unaffected parents are labelled Aa. Three cards explain induction (two unaffected parents with an affected daughter show a recessive, autosomal condition), deduction (IV-1 is aa, so both parents must be Aa) and close relatives (they share grandparents and so can carry the same rare recessive allele).
D3.2.14

Continuous variation comes from many genes and the environment

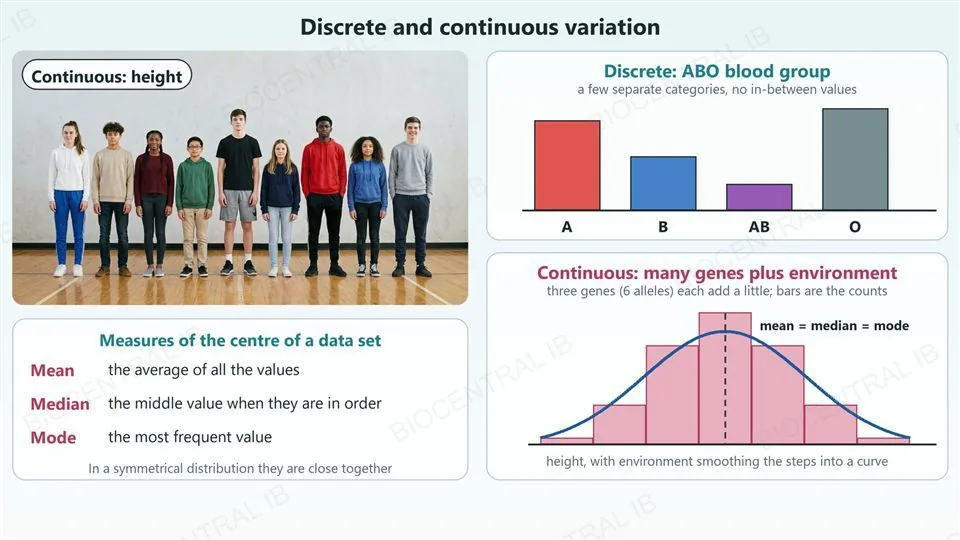
Continuous variation shows a smooth range of values, and it is due to polygenic inheritance and/or environmental factors.
  • Human skin colour is an example: several genes each add a small effect, and the environment adds another.
  • A discrete variable such as ABO blood group falls into separate categories, with no in-between values.
  • For continuous data the mean, median and mode summarize the centre of the distribution.
Why it mattersMany small effects add up to a smooth range of values, not to separate categories.
Left, a photograph of nine students of different heights standing in a row, labelled continuous: height, with definitions of the mean (the average), the median (the middle value) and the mode (the most frequent value). Right, top, a bar chart of the four ABO blood groups A, B, AB and O as separate bars, labelled discrete. Right, bottom, seven adjacent bars showing how many of 64 combinations of three two-allele genes carry 0 to 6 height-increasing alleles, with a smooth curve over them from the environment, and mean, median and mode marked at the same central value.
D3.2.15

A box-and-whisker plot shows six features of the data

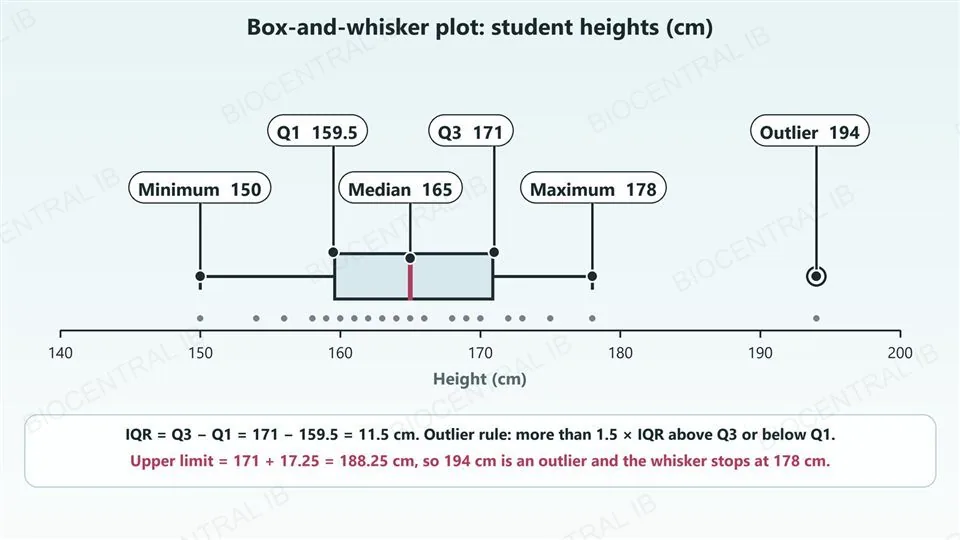
A box-and-whisker plot displays a continuous variable such as student height using the minimum, first quartile, median, third quartile, maximum and any outliers.
  • The box runs from the first quartile (Q1) to the third quartile (Q3), with a line at the median.
  • A value is an outlier if it is more than 1.5 × IQR above Q3 or below Q1, where IQR = Q3 − Q1.
  • The whiskers stop at the smallest and largest values that are not outliers, and outliers are plotted separately.
Why it mattersA box-and-whisker plot for a normal distribution is given in the data booklet.
A horizontal box-and-whisker plot of 21 student heights from 140 to 200 centimetres, with each feature labelled: minimum 150, first quartile 159.5, median 165, third quartile 171, maximum 178 and an outlier at 194. Below it, the working: IQR is 171 minus 159.5 which is 11.5, the upper limit is 171 plus 17.25 which is 188.25, so 194 is an outlier and the whisker stops at 178.

Key vocabulary — patterns and variation

D3.2.7 – D3.2.15: worth being able to define each in a sentence

SNP
A single-nucleotide polymorphism: a difference of one base in the DNA sequence between individuals.
Gene pool
All the genes and their different alleles in a population.
Codominance
The heterozygote has a dual phenotype, with both alleles expressed at once.
Incomplete dominance
The heterozygote has an intermediate phenotype between those of the two homozygotes.
Sex-linked gene
A gene on a sex chromosome; most are on the X chromosome.
Carrier
A heterozygous individual who has a recessive allele but shows no sign of the condition.
Pedigree chart
A family tree that follows a genetic condition through generations, using standard symbols.
Continuous variation
Variation with a smooth range of values, due to polygenic inheritance and/or the environment.
Interquartile range
Q3 minus Q1: the spread of the middle half of the data, used to identify outliers.
Part four · HL

HL — dihybrid crosses, linkage and statistics

D3.2.16 – D3.2.21
D3.2.16 · HL

Chromosomes in meiosis explain the ratios of a dihybrid cross

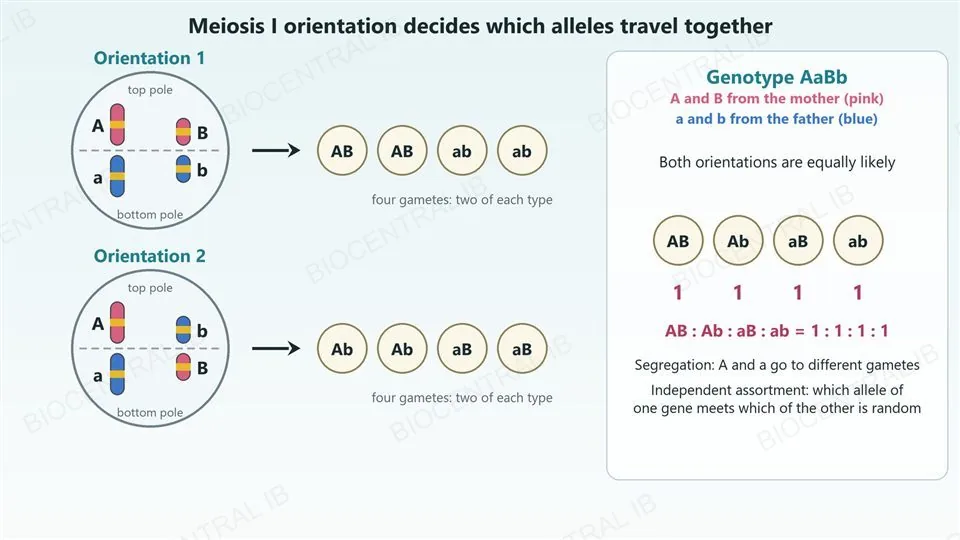
Segregation and independent assortment of unlinked genes in meiosis produce the gamete types that decide the ratios in a dihybrid cross.
  • Segregation: the two alleles of a gene lie on homologous chromosomes, which separate in meiosis I, so each gamete gets one allele.
  • Independent assortment: each pair of homologous chromosomes lines up at the equator independently of the other pairs, so unlinked genes are sorted at random.
  • An AaBb individual therefore makes AB, Ab, aB and ab gametes in equal numbers.
Why it mattersThe movement of chromosomes in meiosis is the physical basis of the ratios seen in crosses.
Two dividing cells in meiosis I with two chromosome pairs at the equator. In orientation 1 the maternal chromosomes A and B (pink) face the top pole and the paternal a and b (blue) the bottom pole, giving gametes AB and ab. In orientation 2 A and b face the top and a and B the bottom, giving gametes Ab and aB. Because both orientations are equally likely, AaBb makes AB, Ab, aB and ab gametes in a 1 : 1 : 1 : 1 ratio.
D3.2.17 · HL

A dihybrid cross gives 9 : 3 : 3 : 1

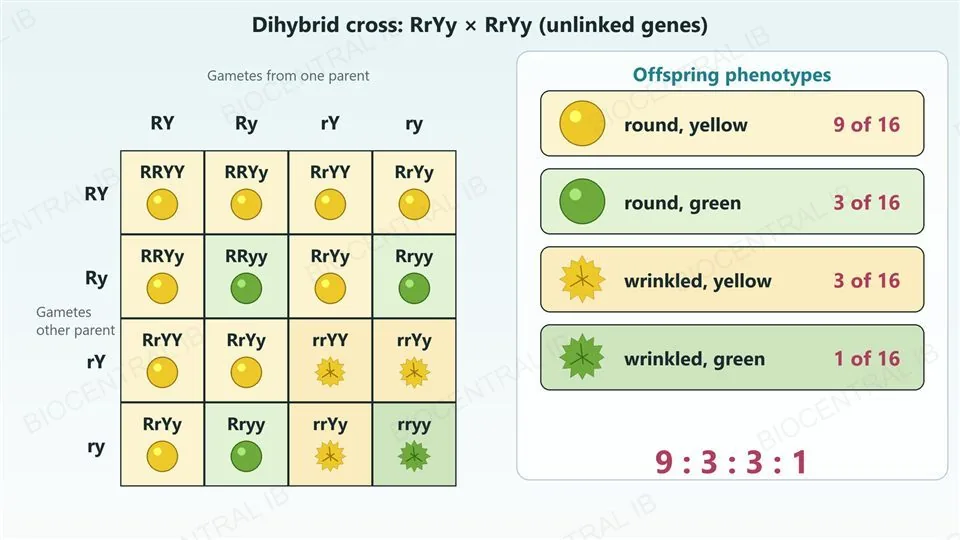
A dihybrid cross between two individuals heterozygous for two unlinked genes is worked out on a 4 × 4 Punnett grid.
  • Each parent makes four gamete types in a 1 : 1 : 1 : 1 ratio, which give 16 equally likely combinations.
  • For RrYy × RrYy, 9 offspring are round and yellow, 3 round and green, 3 wrinkled and yellow, and 1 wrinkled and green.
  • The 9 : 3 : 3 : 1 ratio is expected only when the two genes assort independently.
Why it mattersCount the grid rather than memorizing it: 16 boxes, 9 + 3 + 3 + 1.
A four by four Punnett grid for RrYy by RrYy with gametes RY, Ry, rY and ry along each side and a genotype and a seed icon in each box: round yellow, round green, wrinkled yellow or wrinkled green. A key counts the offspring: round yellow 9 of 16, round green 3 of 16, wrinkled yellow 3 of 16, wrinkled green 1 of 16, a ratio of 9 : 3 : 3 : 1.
D3.2.17 · HL

A testcross gives 1 : 1 : 1 : 1, and Mendel’s law has exceptions

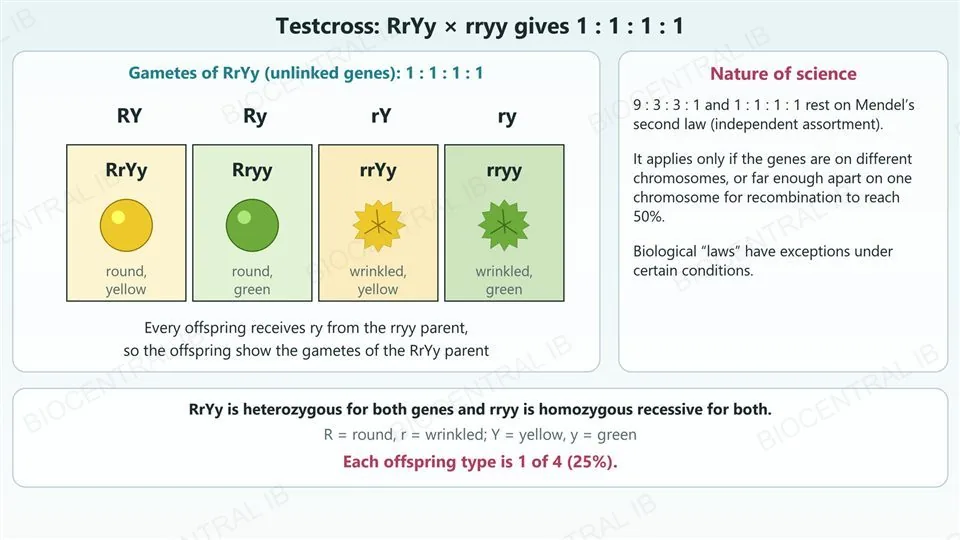
In a testcross an individual heterozygous for both genes is crossed with an individual that is homozygous recessive for both genes.
  • The homozygous recessive parent gives only ry gametes, so the offspring show the gametes of the heterozygous parent.
  • For unlinked genes those gametes are in a 1 : 1 : 1 : 1 ratio, so the offspring are too.
  • Mendel’s second law applies only if the genes are on different chromosomes, or far enough apart on one chromosome for recombination to reach 50%; like every biological law it has exceptions.
Why it mattersA testcross reveals the gamete ratio of the heterozygous parent.
A testcross of RrYy with rryy. The RrYy parent makes gametes RY, Ry, rY and ry, and every offspring also receives ry, giving four offspring types in equal numbers: RrYy round yellow, Rryy round green, rrYy wrinkled yellow and rryy wrinkled green, each 1 of 4. A side card on the nature of science says the ratios depend on Mendel’s second law, which applies only to unlinked genes, and that biological laws have exceptions.
D3.2.18 · HL

Every gene has a locus and a polypeptide product

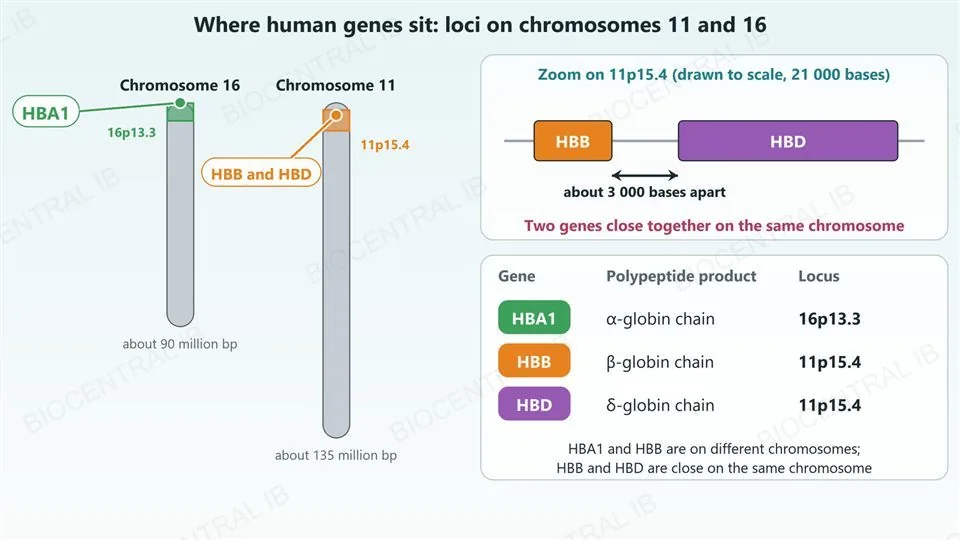
The locus of a human gene is its position on a chromosome, and gene databases link each gene to the polypeptide it codes for.
  • The genes for α-globin (HBA1, chromosome 16) and β-globin (HBB, chromosome 11) have loci on different chromosomes.
  • The genes for β-globin (HBB) and δ-globin (HBD) lie close together on chromosome 11, about 3 000 bases apart.
  • Databases such as NCBI Gene and Ensembl list the locus and the polypeptide product of any gene.
Why it mattersA gene’s locus shows whether two genes are likely to be inherited independently or together.
Chromosome 16 and chromosome 11 drawn to scale as grey bars, with the band 16p13.3 shaded green near the top of chromosome 16 marked HBA1 and the band 11p15.4 shaded orange near the top of chromosome 11 marked HBB and HBD. A zoom to scale shows the HBB and HBD genes about 3 000 bases apart. A table lists HBA1 gives the alpha-globin chain at 16p13.3, HBB the beta-globin chain at 11p15.4 and HBD the delta-globin chain at 11p15.4.
D3.2.19 · HL

Linked genes tend to be inherited together

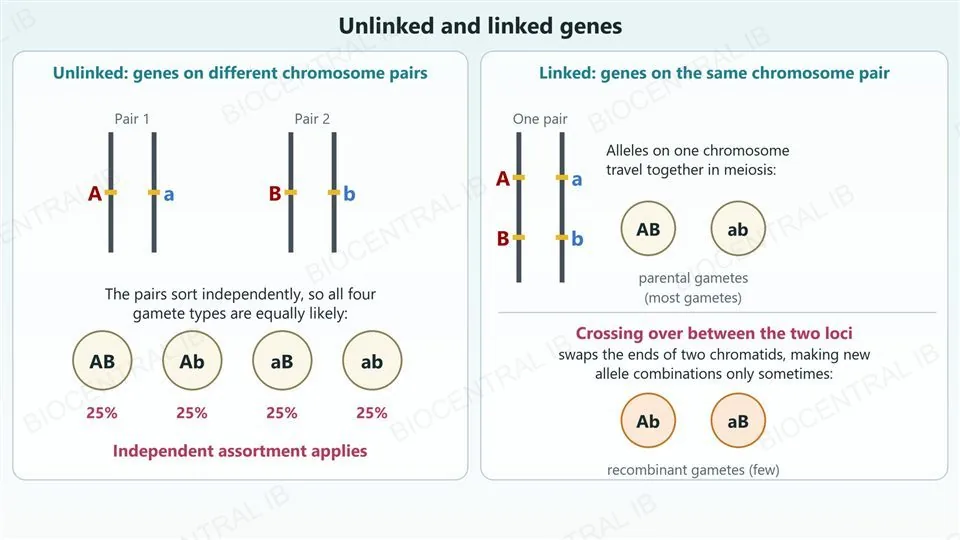
Autosomal genes that lie close together on the same chromosome are linked, and their alleles can fail to assort independently.
  • Alleles on one chromosome are passed on together, unless crossing over happens between the two loci.
  • In diagrams of linkage the alleles are written alongside vertical lines that represent the homologous chromosomes.
  • Crossing over between close loci is uncommon, so most gametes carry the parental combination of alleles.
Why it mattersLinkage is the reason the 9 : 3 : 3 : 1 and 1 : 1 : 1 : 1 ratios can fail.
Two panels. Left, unlinked genes: two chromosome pairs drawn as vertical lines, one carrying A and a and the other B and b, sorting independently into four gamete types AB, Ab, aB and ab at 25 percent each. Right, linked genes: one pair of vertical lines with A and B on one chromosome and a and b on the other, which are passed on as parental gametes AB and ab, and only when crossing over occurs between the two loci do the recombinant gametes Ab and aB appear, a few.
D3.2.20 · HL

Recombinants show that crossing over happened

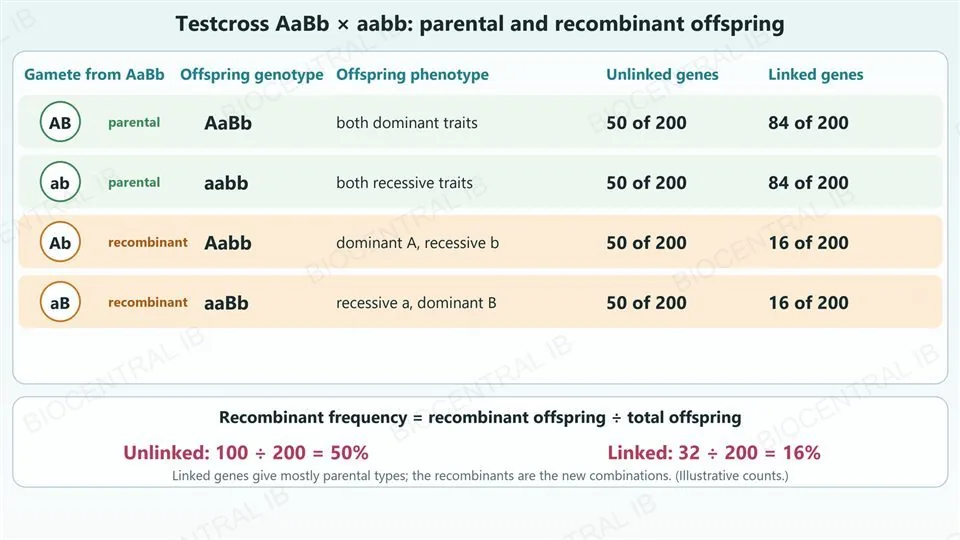
A recombinant has a combination of alleles that differs from the parental combinations of the heterozygote in a testcross.
  • Recombinants can be identified in the gametes (Ab and aB), in the genotypes of the offspring (Aabb and aaBb) and in the phenotypes of the offspring.
  • For unlinked genes half of the offspring are recombinants, and all four types are equally common.
  • For linked genes most offspring are parental types, so the recombinant frequency is well below 50% (16% in the example).
Why it mattersThe recombinant frequency shows how closely two genes are linked.
A table for a testcross of AaBb with aabb showing the gamete from AaBb, the offspring genotype, the offspring phenotype and the counts out of 200 for unlinked and linked genes. Parental rows: AB gives AaBb with both dominant traits (50 unlinked, 84 linked) and ab gives aabb with both recessive traits (50 and 84). Recombinant rows: Ab gives Aabb (50 and 16) and aB gives aaBb (50 and 16). The recombinant frequency is 100 out of 200, 50 percent, for unlinked genes and 32 out of 200, 16 percent, for linked genes.
D3.2.21 · HL

The chi-squared test asks whether the differences are due to chance

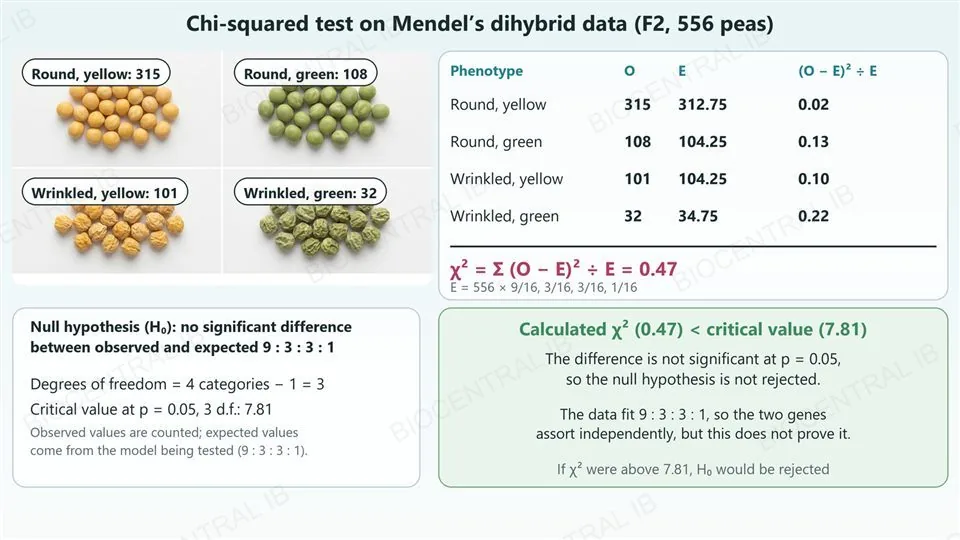
The chi-squared test compares observed results with the results expected from a model, using χ² = Σ (O − E)² ÷ E.
  • The null hypothesis is that there is no significant difference between observed and expected results, and the alternative is that there is one.
  • Degrees of freedom are the categories minus 1, and the calculated χ² is compared with the critical value at p = 0.05.
  • For Mendel’s peas χ² is 0.47, below the critical value of 7.81 at 3 degrees of freedom, so the null hypothesis is not rejected.
  • The F2 generation is a sample that stands for a whole population.
Why it mattersFailing to reject the null hypothesis does not prove the model true.
Left, a photograph of four heaps of dried peas labelled with Mendel’s observed F2 counts: round yellow 315, round green 108, wrinkled yellow 101 and wrinkled green 32, out of 556. Right, a table of observed and expected counts (312.75, 104.25, 104.25 and 34.75) with (O minus E) squared over E of 0.02, 0.13, 0.10 and 0.22, summing to a chi-squared of 0.47. With 3 degrees of freedom the critical value at p = 0.05 is 7.81, so 0.47 is below it and the null hypothesis is not rejected.
Quick check · HL

A testcross of AaBb with aabb gives 84 AaBb, 84 aabb, 16 Aabb and 16 aaBb offspring. What does this show?

The genes are linked, and AaBb and aabb are the recombinants
The genes are linked, and Aabb and aaBb are the recombinants, 16% of the offspring
The genes are unlinked, because four different phenotypes appear
The genes are unlinked, because 84 is close to the expected 100
Correct answer: the genes are linked, and Aabb and aaBb are the recombinants, 16% of the offspring. Unlinked genes would give four offspring types in equal numbers (1 : 1 : 1 : 1, about 50 each out of 200). Here the parental types AaBb and aabb are the great majority, so the genes are linked, and the recombinants are the new combinations Aabb and aaBb: (16 + 16) ÷ 200 = 16% (D3.2.19, D3.2.20).

Key vocabulary — HL

HL only: D3.2.16 – D3.2.21

Segregation
The separation of the two alleles of a gene into different gametes in meiosis.
Independent assortment
The random orientation of each pair of homologous chromosomes, so unlinked genes are sorted independently.
Dihybrid cross
A cross that follows two genes at once.
Locus
The position of a gene on a chromosome.
Linked genes
Genes close together on the same chromosome, which tend to be inherited together.
Recombinant
A gamete, genotype or phenotype with a combination of alleles that differs from the parental combinations.
Null hypothesis
The statement that there is no significant difference between observed and expected results.
Chi-squared test
A statistical test comparing observed results with expected results, using χ² = Σ (O − E)² ÷ E.
Degrees of freedom
The number of categories minus 1, used to find the critical value.

Where this shows up again

D2.1 · Meiosis
D3.2.1 and D3.2.16 · HL rest on meiosis as a reduction division (D2.1.9) and on random orientation of bivalents and crossing over (D2.1.11). Explain how meiosis and fertilization give a zygote one allele of each gene from each parent.
D1.3 · Mutation, and D4.1 · Gene pools
SNPs (D3.2.8) result from base substitution mutations (D1.3.2), and a gene pool is all the alleles in a population (D4.1.9). Explain how a base substitution can create a new allele.
D2.2 · Gene expression
Phenotypic plasticity (D3.2.6) is a change in gene expression with no change of genotype, and D2.2.8 gives examples of environmental effects on expression. Explain how one genotype can give different phenotypes.
C4.1 · Sampling and statistics · HL link
The chi-squared test of D3.2.21 is used again for species association in C4.1.15, and random sampling in C4.1.2 raises the same question about samples. What are the principles of effective sampling in biological research?

D3.2 Inheritance — one-page recap

Screenshot this slide to revise from

Gametes and crosses
  • Haploid gametes fuse to a diploid zygote: one allele from each parent. Cross: P, F1, F2, Punnett grid. Monohybrid F2: 3 : 1 phenotypes, 1 : 2 : 1 genotypes.
Genotype and phenotype
  • Genotype = alleles (homozygous or heterozygous). Phenotype = genotype + environment. Dominant: one copy is enough. Plasticity changes gene expression, not DNA, and can be reversible.
Patterns of inheritance
  • PKU: recessive, faulty enzyme. Multiple alleles: many in the gene pool, two per person. ABO: IA, IB, i. Codominance: dual (AB). Incomplete dominance: intermediate (pink Mirabilis).
Sex linkage, pedigrees, variation
  • Sperm X or Y decides sex, 1 : 1. Haemophilia: Xh, males need one copy. Pedigree: induce the pattern, deduce genotypes. Continuous = polygenic + environment. Box plot: min, Q1, median, Q3, max, outliers (1.5 × IQR).
HL · Meiosis and dihybrid crosses
  • Segregation and independent assortment. RrYy × RrYy gives 9 : 3 : 3 : 1; testcross gives 1 : 1 : 1 : 1. Mendel's second law fails for linked genes.
HL · Linkage and statistics
  • Every gene has a locus. Recombinants come from crossing over: 50% if unlinked, fewer if linked. χ² = Σ (O − E)² ÷ E; compare with the critical value at p = 0.05; H₀ is not proved.

One gene at a time, then two, then many

Inheritance starts with a simple fact: a zygote gets one allele of each gene from each parent. From that, dominance, multiple alleles, sex linkage and pedigrees explain the patterns seen in families, continuous variation shows what happens when many genes and the environment act together, and at HL the behaviour of chromosomes in meiosis explains dihybrid ratios, linkage and the statistics used to test them.
D3.2 Inheritance · BioCentral IB
Use ↓ ↑ or click to navigate
01 / 20