BioCentral IBBioCentral IB
IB Biology · Theme D · D4.3

Climate change

Two rising gases, a handful of self-reinforcing feedbacks, and consequences that run from melting ice and dying reefs to shifted ranges, mistimed spring events and evolution in real time. This is how rising carbon dioxide and methane reshape whole ecosystems.
Guiding questions

What are the drivers of climate change?

What are the impacts of climate change on ecosystems?

Part one

Drivers, feedbacks and a tipping point

D4.3.1 – D4.3.3
D4.3.1

Two gases, two rising curves

Anthropogenic (human-caused) climate change is driven by rising atmospheric concentrations of two greenhouse gases: carbon dioxide (CO2) and methane (CH4).
  • CO2 has risen from about 280 parts per million (ppm) before industrialization to about 420 ppm today, mainly from burning fossil fuels and from deforestation, which releases stored carbon and removes photosynthesizing trees.
  • Methane has risen from about 720 to about 1,920 parts per billion (ppb), from livestock digestion, rice paddies, landfill waste and fossil fuel extraction.
  • Both gases absorb outgoing infrared radiation and re-emit it, so more heat is retained: the enhanced greenhouse effect.
Why it mattersEvery impact in this topic traces back to these two rising curves.
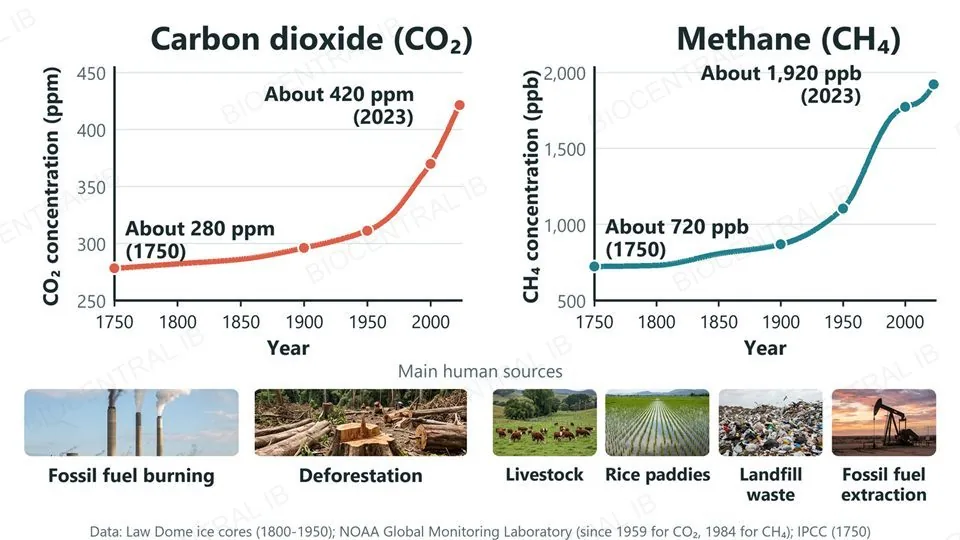
Two line graphs of atmospheric concentration from 1750 to 2023: carbon dioxide rising from about 280 to about 420 parts per million, and methane rising from about 720 to about 1,920 parts per billion, with photographs of the main human sources beneath each graph: fossil fuel burning and deforestation for carbon dioxide; livestock, rice paddies, landfill waste and fossil fuel extraction for methane
D4.3.2

Melting ice makes more melting

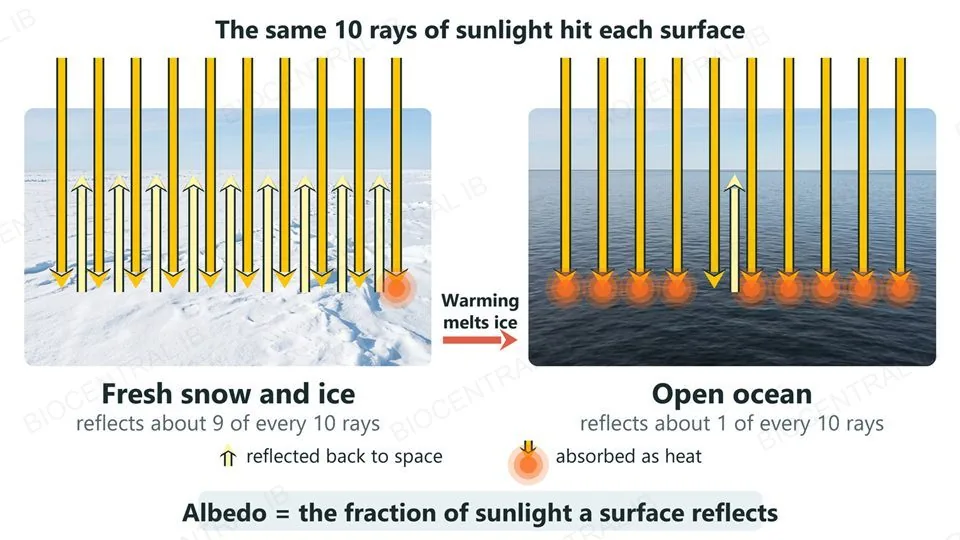
A positive feedback cycle is a self-reinforcing loop: warming causes a change that itself causes further warming, amplifying the original change.
  • Albedo is the fraction of incoming sunlight a surface reflects. Fresh snow reflects roughly 80–90%, sea ice about 50–70%, and open ocean only about 6–10%.
  • Warming melts snow and ice, exposing darker ocean or land that absorbs far more solar radiation.
  • The extra absorbed energy warms the region further, melting more ice, and the loop repeats.
Why it mattersLoss of reflective snow and ice is one of the five named positive feedbacks in this topic.
Photographs of bright fresh snow and dark open ocean, each receiving the same ten arrows of sunlight: over the snow nine arrows are reflected back and one is absorbed as heat, over the ocean one is reflected and nine are absorbed, with an arrow between them labelled warming melts ice
D4.3.2

Warmer carbon stores release more

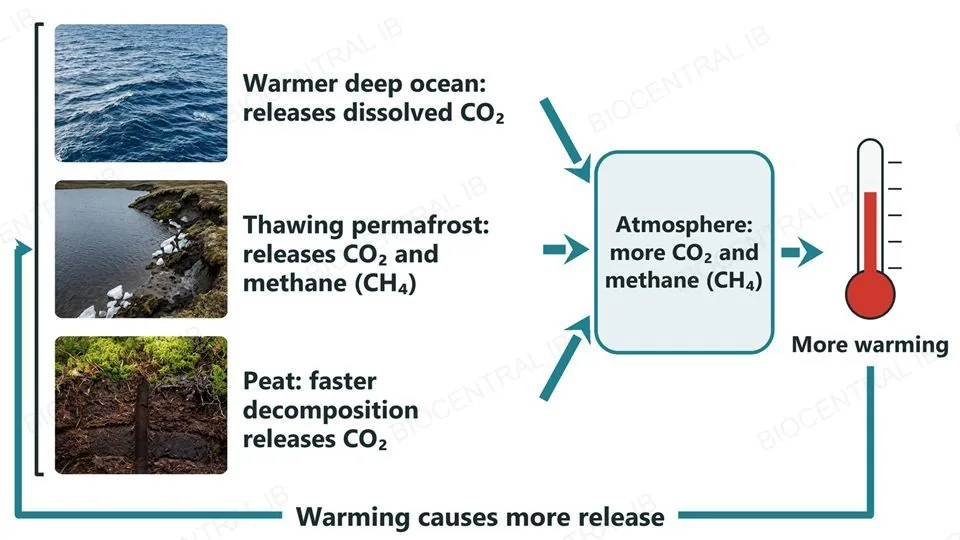
Several feedbacks work by warming a large carbon store so that it releases more carbon dioxide or methane.
  • Deep ocean: a warmer ocean can hold less dissolved gas, so carbon dioxide stored in the deep ocean is released to the atmosphere.
  • Peat and permafrost: as they thaw, organic matter that was previously undecomposed becomes available to decomposers, and faster decomposition releases CO2.
  • Permafrost holds an estimated 1,500 gigatonnes of carbon, about twice the amount in the atmosphere; in waterlogged, oxygen-poor thaw lakes it is released as methane, a potent greenhouse gas.
Why it mattersEach release adds greenhouse gas, causing more warming and so more release: warming can outpace what human emissions alone would cause.
Three photographs, deep ocean, a thawing permafrost lake and a peat bank, each labelled with the greenhouse gas it releases when warmed, with arrows into a box for the atmosphere, on to a thermometer marked more warming, and back to the three stores
D4.3.2

Drought and fire close the loop

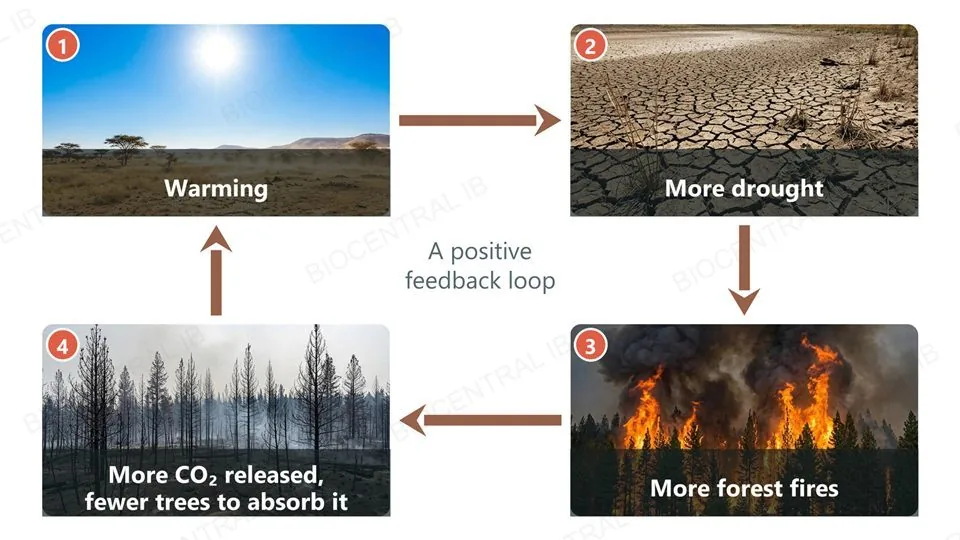
Warming increases droughts and forest fires, and both feed back into more warming.
  • Hotter, drier conditions dry out vegetation and soil, so fires become more frequent and more intense.
  • Fires burn stored organic carbon and release it as CO2 within days, and destroy the plants that would have absorbed CO2 by photosynthesis.
  • More CO2 in the atmosphere and fewer trees to remove it intensify warming, which brings more drought and more fire: a fifth named positive feedback.
Why it mattersThe boreal forest, next, shows this loop operating across a whole biome.
Four photographs joined in a loop by clockwise arrows: a hot dry landscape (warming), cracked dry ground (more drought), a forest fire (more forest fires) and burnt trees with smoke (more CO2 released, fewer trees to absorb it), leading back to warming
D4.3.3

The boreal forest flips

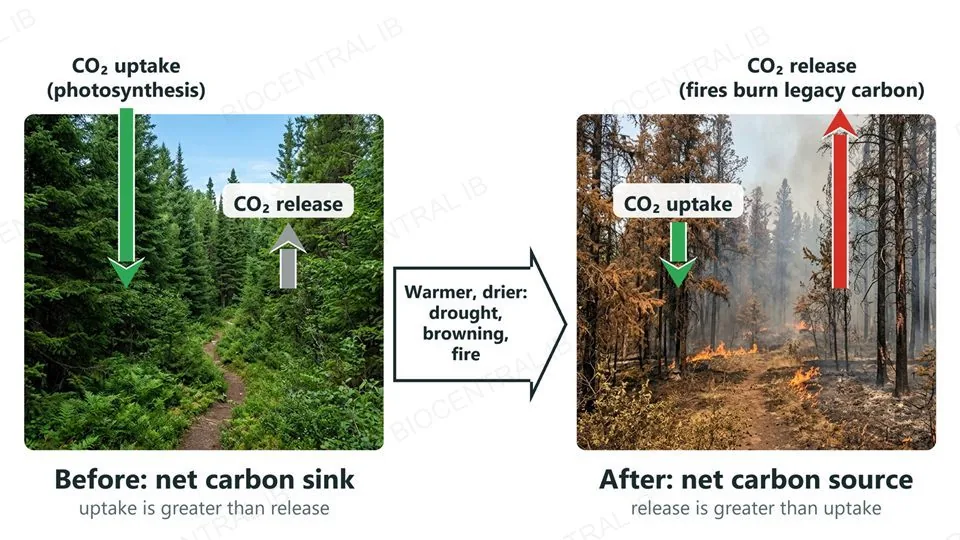
Boreal forest (taiga) has been a net carbon sink, but climate change is pushing it past a tipping point into net carbon loss.
  • Warmer temperatures and decreased winter snowfall cause drought stress, so primary production in the taiga falls and forests show browning.
  • Drought-stressed, browning forest burns more often and more intensely.
  • Fires combust legacy carbon: carbon built up in trees, litter and soil over decades to centuries, released within days.
  • When release exceeds uptake, the forest changes from net carbon accumulation to net carbon loss.
Why it mattersA carbon store that slowed warming becomes a source that speeds it.
A healthy green boreal forest with a long CO2 uptake arrow and a short release arrow, labelled net carbon sink, and after drought, browning and fire a brown, burning forest with a short uptake arrow and a long release arrow, labelled net carbon source
Part two

Impacts on polar, ocean and reef ecosystems

D4.3.4 – D4.3.7
D4.3.4

When the ice goes out too early

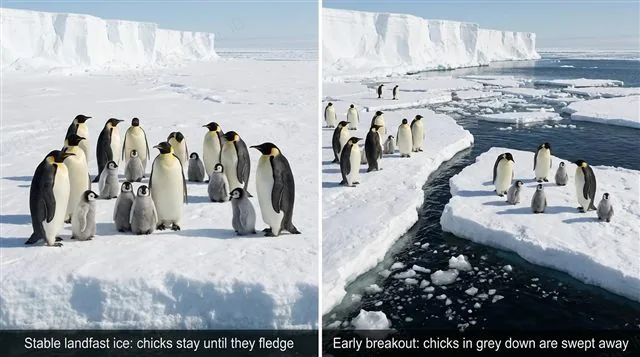
Landfast ice is sea ice that stays attached to the coast, an ice shelf or grounded icebergs instead of drifting; emperor penguins (Aptenodytes forsteri) breed on it.
  • Chicks need many months on stable ice to grow waterproof adult plumage before they can survive at sea.
  • If landfast ice breaks out early, chicks that are not yet waterproof are swept into open water, where they die.
  • At Halley Bay in the Antarctic, breeding at a large colony almost completely failed in 2016, 2017 and 2018 after early breakouts, and most adults later moved to a different site.
Why it mattersEarly breakout removes breeding grounds, a direct loss of habitat.
Two scenes of emperor penguins: on the left, adults and grey chicks on stable landfast ice; on the right, after an early breakout, the ice has split into drifting slabs with open water between them and chicks in grey down are stranded on the floating pieces
D4.3.4

A walrus needs its floating platform

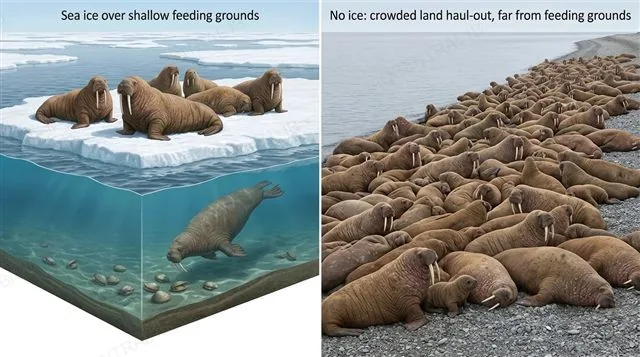
Walruses feed on molluscs on the shallow sea floor and rest on floating sea ice above those feeding grounds.
  • With ice over shallow water, a walrus can dive, feed and rest on the same patch of sea.
  • As Arctic sea ice retreats, walruses are forced onto crowded land haul-outs far from the ice, sometimes tens of thousands together, as near Point Lay, Alaska.
  • Females and calves must swim farther to feed, and a disturbance in a dense crowd can cause a stampede in which calves are crushed.
Why it mattersMelting sea ice is a loss of habitat, not just a warmer environment.
Two scenes of walruses: on the left, walruses resting on floating sea ice above shallow water with clams on the sea floor; on the right, a dense crowd of walruses on a bare beach with no sea ice in sight
D4.3.5

A warm lid on the ocean

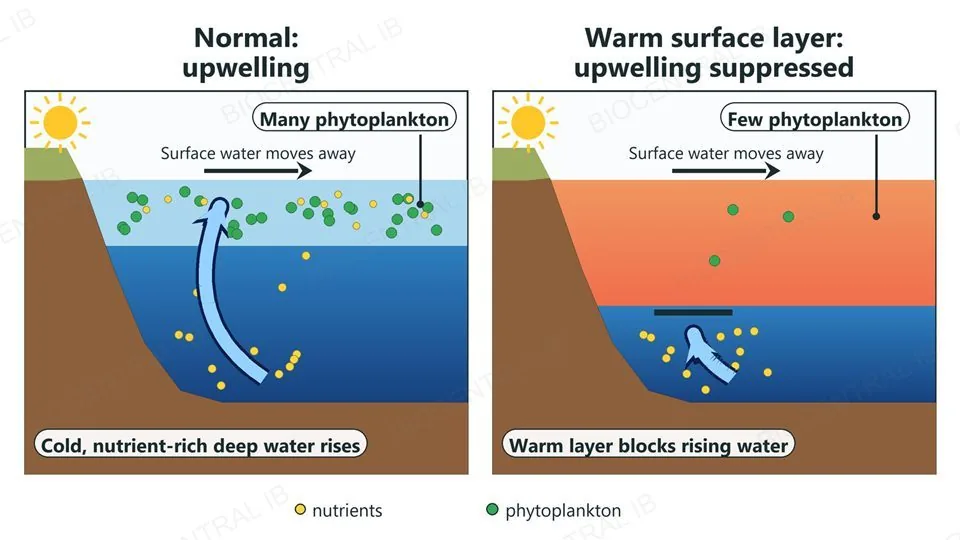
Upwelling is the rise of cold, nutrient-rich deep water to the sunlit surface, and it supports some of the most productive marine ecosystems.
  • Warmer surface water is less dense, so it forms a stable layer on top of the colder water below and resists the mixing that upwelling needs.
  • With upwelling suppressed, fewer nutrients reach the surface, so phytoplankton (the primary producers) grow less and primary production falls.
  • Less energy then flows through marine food chains to zooplankton, fish and the animals that eat them.
Why it mattersIn El Niño years, warm water suppresses upwelling off Peru and anchoveta catches collapse, a natural preview of the effect.
Two ocean cross-sections beside the same coast: in the first, surface water moves away from the coast, cold nutrient-rich deep water rises and many phytoplankton grow; in the second, a thick warm surface layer blocks the rising water and only a few phytoplankton grow
D4.3.6

Birds climbing the mountain

Species track the temperatures they are adapted to, so warming moves populations upslope or towards the poles.
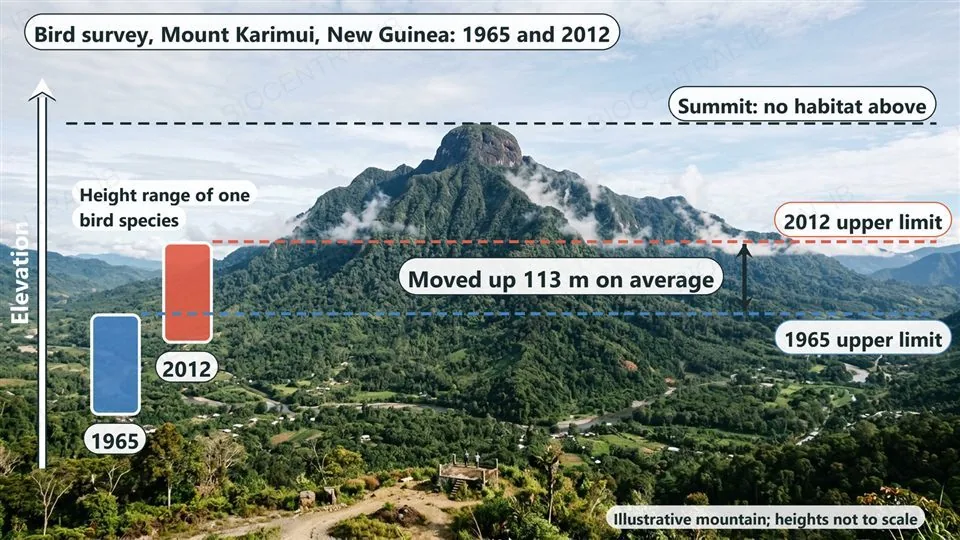
  • In New Guinea, Freeman and Class Freeman resurveyed the birds of Mount Karimui in 2012, 47 years after a 1965 survey. Species' upper limits had moved uphill by 113 m on average.
  • The temperatures these birds tolerate now occur higher up, so populations moved up with them.
  • Range shifting is not an unlimited escape: a species already near the summit has no higher habitat to move into.
Why it mattersTropical mountaintop specialists are the most exposed, as they can run out of mountain.
A photograph of a forested tropical mountain in New Guinea with the height range of one bird species drawn as a 1965 bar and a higher 2012 bar, dashed lines marking each upper limit with a label showing it moved up 113 metres on average, and the summit marked as having no habitat above
D4.3.6

Trees shifting north

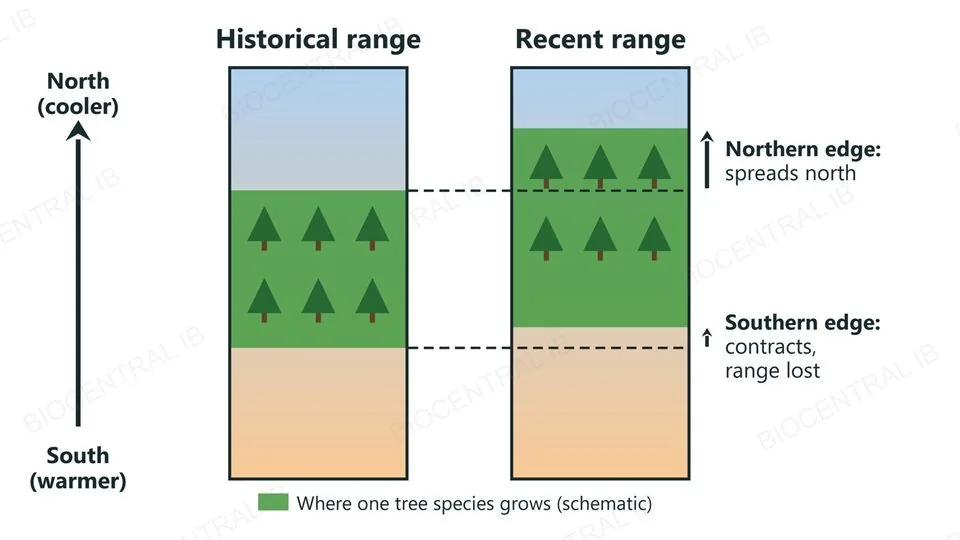
Many North American tree species show range contraction at their warm edge and spread northward at their cool edge: an overall poleward shift.
  • At the warmer southern edge, heat and drought push conditions beyond the species' tolerance, so the range contracts.
  • At the cooler northern edge, warming makes conditions newly suitable, so seedlings establish and the range spreads north.
  • The evidence comes from comparing forest-inventory records of where trees grow, made decades apart.
Why it mattersTrees disperse only by seed, so shifts take generations; the climate may move faster than the forest.
Two north-south strips representing the historical and recent range of a tree species: the recent range has its southern edge moved slightly north (contraction) and its northern edge moved further north (spread)
D4.3.7

Acid oceans, thinner skeletons

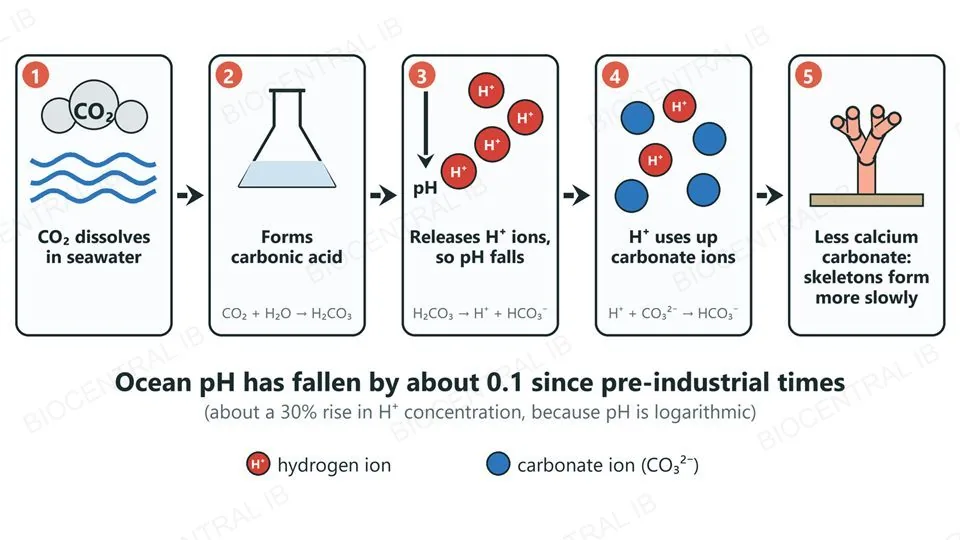
Ocean acidification is a fall in seawater pH caused by dissolved CO2, and it suppresses calcification, the building of coral skeletons.
  • CO2 dissolves in seawater and reacts with water to form carbonic acid, which releases hydrogen ions (H+) and lowers pH.
  • Ocean pH has fallen by about 0.1 units since pre-industrial times, roughly a 30% rise in H+ concentration, because the pH scale is logarithmic.
  • Extra H+ combines with carbonate ions, leaving fewer for corals, which need carbonate and calcium to build calcium carbonate skeletons.
Why it mattersThis threat comes from CO2 dissolving in seawater; it happens without any warming.
A chain of five steps: CO2 dissolves in seawater, forms carbonic acid, releases hydrogen ions so pH falls, hydrogen ions use up carbonate ions, and less calcium carbonate is available so coral skeletons form more slowly, with the equation for each chemical step
D4.3.7

Heat drives the colour out

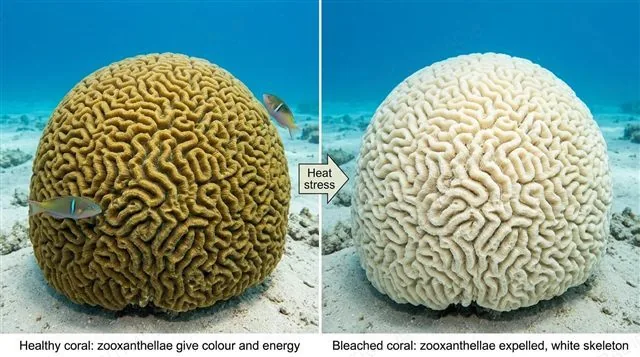
Coral bleaching is the loss of a coral's colour when heat-stressed polyps expel the symbiotic algae (zooxanthellae) living in their tissues.
  • Zooxanthellae photosynthesize inside the coral, giving it its colour and most of its energy.
  • Water only 1–2 °C above the usual summer maximum, sustained for weeks, makes the coral expel them, exposing the white skeleton.
  • A bleached coral is alive but starving. If heat stress continues it dies; if it eases in time, the algae can return.
Why it mattersBleaching is caused by heat; acidification is caused by chemistry. They are separate threats and are often confused.
The same coral colony twice: on the left healthy, brown and colourful with zooxanthellae in its tissue; on the right bleached white after heat stress, with the algae expelled
D4.3.7

When the reef collapses

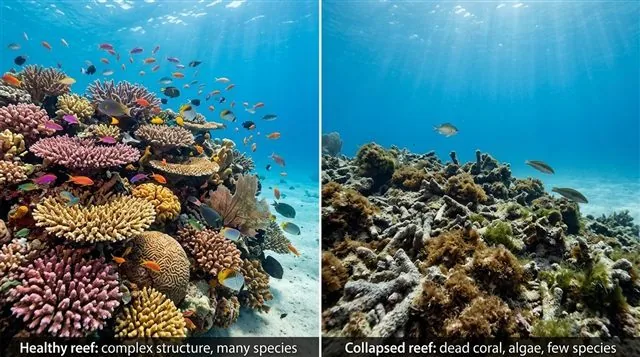
Ecosystem collapse is a loss of structure and function so severe that most of a community's species can no longer persist; coral reefs are a potential example.
  • Reef-building corals create the three-dimensional framework that shelters fish and invertebrates, and their zooxanthellae drive much of the reef's primary production.
  • The Great Barrier Reef has suffered mass bleaching events including 1998, 2002, 2016, 2017, 2020, 2022 and 2024, leaving less time to recover between them.
  • When dead coral crumbles and algae take over, the many species that depend on the reef (an estimated quarter of marine species) lose habitat and food.
Why it mattersAcidification weakens skeleton-building while bleaching kills corals, so together they threaten the reef itself.
A healthy coral reef with many fish and complex coral structure beside a collapsed reef of dead coral rubble, algae and only a few fish
Quick check

Which of these is an example of a positive feedback cycle in global warming?

Dissolved CO2 lowers ocean pH and suppresses calcification in corals
Melting sea ice exposes dark ocean that absorbs more sunlight, which causes more warming and more melting
Heat-stressed corals expel their zooxanthellae and turn white
Emperor penguin chicks drown when landfast ice breaks out early
Correct answer: the ice-albedo loop. A positive feedback is a consequence that itself causes further warming. Loss of reflective ice does this, because darker surfaces absorb more sunlight. Bleaching, acidification and penguin chick loss are serious impacts of climate change, but none of them adds more warming, so none is one of the named feedback cycles.
Part three

Removing carbon: sequestration

D4.3.8
D4.3.8

Three ways to store carbon

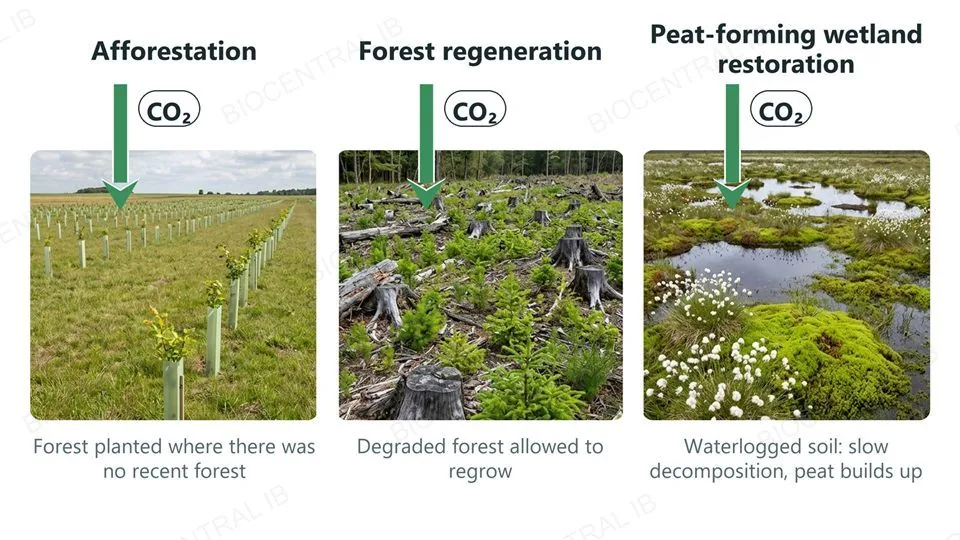
Carbon sequestration is the removal of CO2 from the atmosphere into a longer-term store, and three approaches are named.
  • Afforestation: establishing forest on land that was not recently forested, so trees lock carbon in wood and soil.
  • Forest regeneration: allowing degraded forest to regrow.
  • Restoring peat-forming wetlands: waterlogged soil has little oxygen, so decomposition is slow and dead plant material builds up as peat. Peat forms naturally in temperate and boreal zones, and very rapidly in some tropical ecosystems.
Why it mattersEach approach rebuilds a natural carbon sink that human activity has weakened.
Three photographs, each with a CO2 arrow pointing down into it: young trees in tree guards planted on open farmland (afforestation), seedlings regrowing among old stumps (forest regeneration) and a waterlogged peatland with sphagnum moss and cotton-grass (peat-forming wetland restoration)
D4.3.8

Plantation or rewilding?

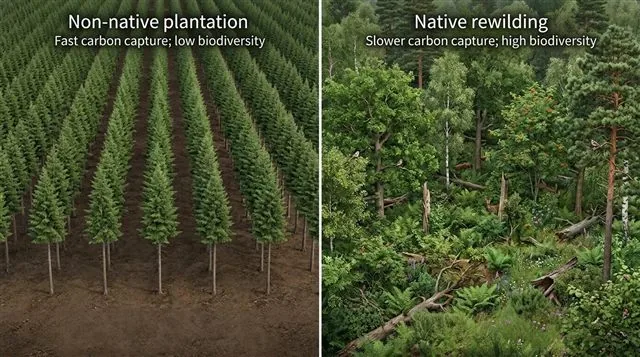
There is active scientific debate over whether plantations of non-native trees or rewilding with native species is the better route to carbon sequestration.
  • Non-native plantations, often fast-growing trees planted in rows, can capture carbon quickly, but as monocultures they support little biodiversity and are more vulnerable to pests, disease and drought.
  • Rewilding with native species captures carbon more slowly at first, but builds a diverse, self-sustaining and more resilient ecosystem.
  • A fair evaluation weighs rate of capture, biodiversity, and how secure the stored carbon is against fire, pests and drought.
Why it mattersNo single answer is settled: the trade-off is speed of carbon capture against long-term ecological value.
A plantation of evenly spaced, same-age non-native trees in rows compared with a native rewilded forest of mixed species and ages, each with a caption on carbon capture speed and biodiversity

Key vocabulary — causes, impacts and sequestration

Worth being able to define in a single sentence each

Positive feedback cycle
A self-reinforcing loop in which warming causes a change that itself causes further warming.
Albedo
The fraction of incoming sunlight that a surface reflects; snow and ice have a high albedo, open ocean a low one.
Legacy carbon
Carbon accumulated slowly in biomass, litter and soil or peat over decades to centuries, which fire can release within days.
Landfast ice
Sea ice that stays attached to the coast, an ice shelf or grounded icebergs rather than drifting.
Upwelling
The rise of cold, nutrient-rich deep water to the surface, fuelling high primary production.
Ocean acidification
A fall in ocean pH caused by dissolved CO2, which reduces carbonate ions and suppresses calcification.
Coral bleaching
The expulsion of zooxanthellae by heat-stressed corals, leaving a white skeleton.
Carbon sequestration
The removal of atmospheric CO2 into a longer-term store, such as growing forest or peat.
Part four · HL

HL — timing, synchrony and evolution

D4.3.9 – D4.3.12
D4.3.9 · HL

Reading the calendar of life

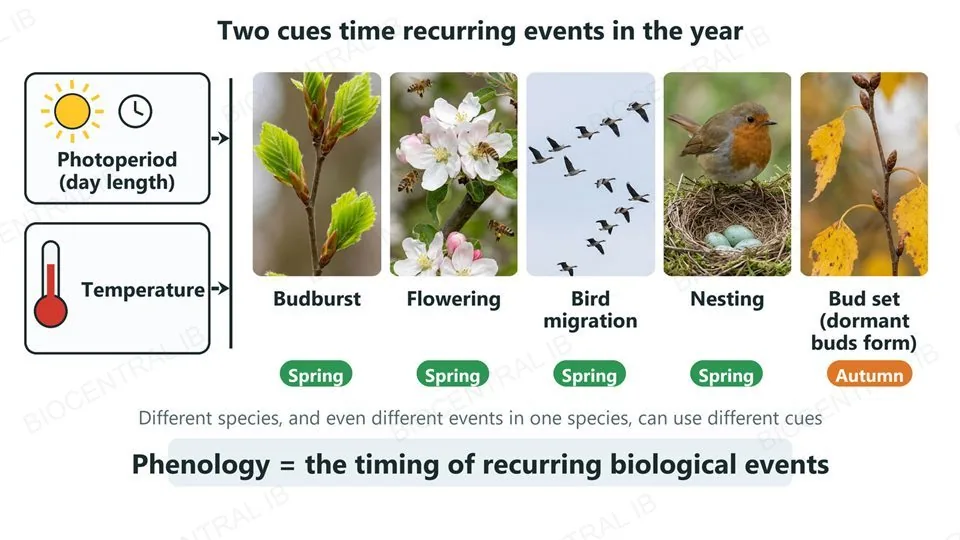
Phenology is research into the timing of biological events, such as flowering, budburst, bird migration and nesting.
  • Budburst is the opening of buds in spring; bud set is the formation of dormant buds in deciduous trees as the growing season ends.
  • Two cues time these events. Photoperiod (day length) is set by latitude and Earth's tilt, so warming does not change it. Temperature is changed by climate change.
  • Different species, and even different events in one species, can rely on different cues.
  • Long-term records show the shift: British plants' first flowering averaged 4.5 days earlier in the 1990s than in the previous four decades (385 species).
Why it mattersBecause cues differ, warming can shift one species' schedule and leave another's unchanged.
Two cues, photoperiod (day length) and temperature, point to five photographed recurring events: budburst, flowering, bird migration and nesting (all in spring) and bud set (in autumn)
D4.3.10 · HL

Out of step

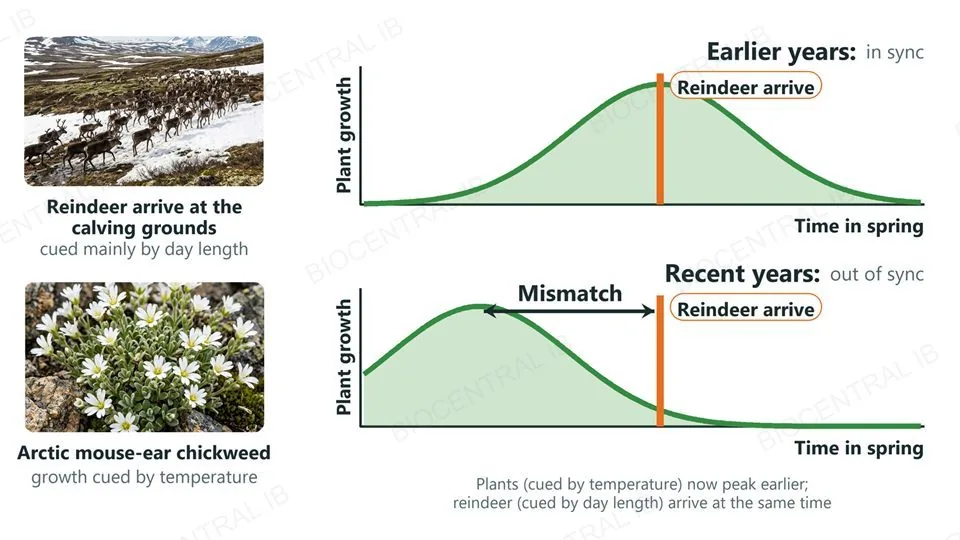
Phenological mismatch occurs when interacting species use different cues, so climate change pulls their timing apart.
  • In West Greenland, the spring growth of Arctic mouse-ear chickweed (Cerastium arcticum) is cued by temperature, so it now starts earlier as the Arctic warms.
  • Migrating reindeer (Rangifer tarandus) time their arrival at the calving grounds mainly by day length, which warming does not change.
  • Reindeer now arrive after the peak of plant growth, when forage is poorer. Calf production per female fell about fourfold in one long-term study (Post and Forchhammer, 2008).
Why it mattersIn an answer, name the cue each species uses. "Some species are affected more" is not a mechanism.
Photographs of reindeer on spring tundra and of Arctic mouse-ear chickweed, beside two graphs of plant growth against time in spring with the reindeer arrival marked at the same time in both: in earlier years the reindeer arrive at the growth peak; in recent years the growth peak has moved earlier and an arrow labelled mismatch separates it from the reindeer arrival
D4.3.11 · HL

One extra generation, a much bigger outbreak

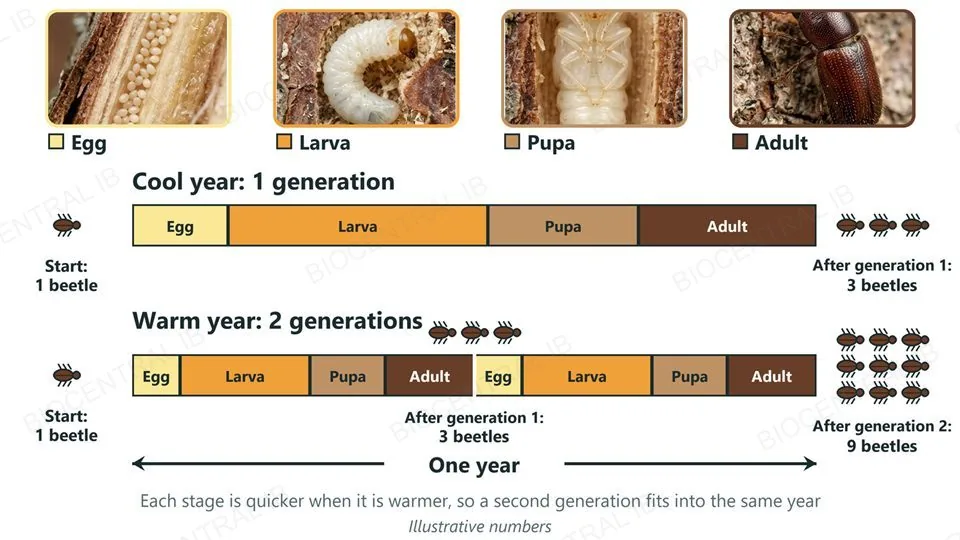
Warmer temperatures speed insect development, so an insect can complete more life cycles (generations) within a year.
  • The spruce bark beetle (Ips typographus) develops through egg, larva, pupa and adult under the bark of spruce trees, and each stage takes less time when it is warmer.
  • In cool conditions it completes one generation a year; in warm summers it can complete a second.
  • Numbers multiply with each generation, so one extra generation greatly increases the population within a single year.
  • Drought-stressed trees make less resin, their main defence, so more trees are killed in outbreaks such as the one after the 2018 European drought.
Why it mattersWarming can increase pest populations, killing forest and releasing stored carbon.
Photographs of the four life stages of the spruce bark beetle (egg, larva, pupa, adult) above two timelines of one year using the same stage colours: a cool year with one generation in which 1 beetle becomes 3, and a warm year with two shorter generations in which 1 becomes 3 and then 9, using illustrative numbers
D4.3.12 · HL

Less snow, more brown owls

Climate change can act as a selective pressure: it changes the fitness of heritable variants, so their frequencies change over generations. That is evolution.
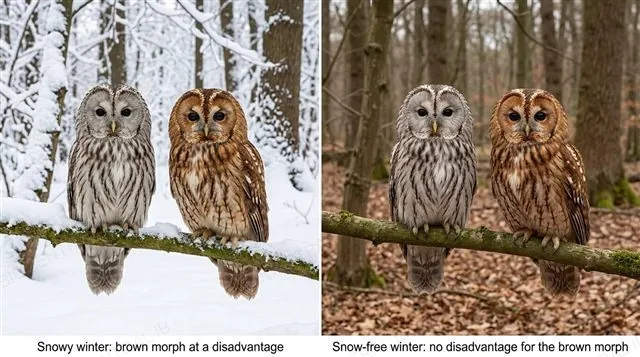
  • Tawny owls (Strix aluco) occur as grey and brown colour morphs, and the difference is inherited.
  • In Finland, brown owls survived less well than grey owls in snow-rich winters.
  • As winters became milder with less snow, that disadvantage faded, and the brown morph has become more common since the 1960s.
  • Individual owls do not change colour. The population changes because the variants differ in survival and reproduction.
Why it mattersDeclining snow cover shifts the population steadily towards one existing phenotype: directional selection (D4.1).
A grey and a brown tawny owl in a snowy winter forest, where the brown owl is at a disadvantage, compared with the same two owls in a snow-free winter forest where it is not
Quick check · HL

In a warming Arctic, plant growth starts earlier each year but reindeer still arrive at their calving grounds at the same time. Which explanation best fits this?

Reindeer cannot detect temperature, so they are evolving faster than the plants
The plants are cued by temperature, which is rising, whereas the reindeer are cued mainly by day length, which climate change does not alter
Warmer temperatures slow plant growth, so the plants peak later than the reindeer expect
Day length has shortened in the Arctic, so the reindeer arrive earlier than before
Correct answer: different cues for each species. Phenological mismatch arises when interacting species rely on different cues. The plants' timing follows temperature and advances, while the reindeer's follows photoperiod and stays put, so the reindeer now arrive after peak plant growth.

Key vocabulary — timing, synchrony and evolution · HL

HL only: D4.3.9 – D4.3.12

Phenology
The study of the timing of recurring biological events, such as flowering, budburst, migration and nesting.
Photoperiod
Day length: set by latitude and Earth's tilt and unaffected by climate change.
Bud set
The formation of dormant buds in deciduous trees at the end of the growing season.
Phenological mismatch
Loss of synchrony between interacting species whose timing is cued differently.
Voltinism
The number of generations an insect completes in a year; warming can increase it.
Colour morph
One of several genetically determined colour forms in a species, such as grey and brown tawny owls.

Where this shows up again

D4.2 · Stability and change
D4.2 defines a tipping point using Amazon rainforest dieback. Using the boreal forest (D4.3.3), explain how a different positive feedback, drought and fire rather than reduced transpiration, can push another biome past a comparable tipping point.
D4.1 · Natural selection
Natural selection changes allele frequencies when the selection pressure changes. Using the tawny owl (D4.3.12), explain how declining snow cover altered the relative fitness of the grey and brown morphs, and why this is evolution and not owls changing their own colour.
C4.2 · Transfers of energy and matter
The carbon cycle has natural sinks (oceans, forests, soils and peat) and sources. Explain how afforestation and peat-forming wetland restoration (D4.3.8) try to re-strengthen sinks that human activity has weakened.
C1.3 · Photosynthesis
Photosynthesis is how forests and wetlands remove atmospheric CO2. Discuss why the rate of carbon capture by afforestation is limited compared with the rate at which fossil fuel combustion releases CO2 (D4.3.1, D4.3.8).

D4.3 Climate change — one-page recap

Screenshot this slide to revise from

Drivers
  • Human-caused rises in CO2 (about 280 to 420 ppm; fossil fuels, deforestation) and methane (about 720 to 1,920 ppb; livestock, rice, landfill, fossil fuel extraction).
  • Both absorb and re-emit infrared radiation, retaining heat.
Positive feedbacks
  • Warming causes a change that causes more warming: ice-albedo loss, CO2 from the deep ocean, faster decomposition of peat and permafrost, methane from permafrost, more drought and fire.
  • Boreal forest tipping point: drought, browning and fire burn legacy carbon, so net accumulation becomes net loss.
Polar and ocean
  • Landfast ice breakout kills emperor penguin chicks; sea ice loss forces walruses onto crowded land.
  • Warm surface water suppresses upwelling, cutting nutrients, phytoplankton and food-chain energy.
Ranges and reefs
  • Range shifts upslope (New Guinea birds, 113 m) and poleward (North American trees); species at summits have nowhere to go.
  • Reefs: acidification suppresses calcification, bleaching expels zooxanthellae; together they risk collapse.
Sequestration
  • Afforestation, forest regeneration and peat-forming wetland restoration store carbon.
  • Debate: fast non-native plantations vs slower but more diverse, resilient native rewilding.
HL · Timing and evolution
  • Phenology cues (photoperiod, temperature) can drift apart: chickweed vs reindeer mismatch; an extra spruce bark beetle generation per year.
  • Tawny owls: less snow raised the fitness of brown morphs, so the morph frequency changed.

Small changes in two gases, large changes in every ecosystem

From the ice edge to the coral reef, warming acts on the timing, distribution and even the genetics of life, and feedbacks can make the change accelerate.
D4.3 Climate change · BioCentral IB
Use ↓ ↑ or click to navigate
01 / 20